HotXLS is a native spreadsheet component for Delphi and C++Builder, and since version 2.209.0 it can answer the question Excel normally keeps to itself: for this exact cell, which conditional formatting rules fire, and what fill, font, data bar or icon do they resolve to. That answer is what you need the moment your output is an HTML report, a PDF, or a grid you paint yourself
This is a different problem from creating rules. Two earlier notes cover the authoring side: conditional formatting and rich text styles deals with attaching rules and differential formats to a range, and partitioning anchored conditional formats deals with what happens to a rule range when rows and columns are inserted or deleted. Both are structural. This one is about semantics: given a workbook that already carries rules, compute the highlight
Why the file format does not tell you which cells light up
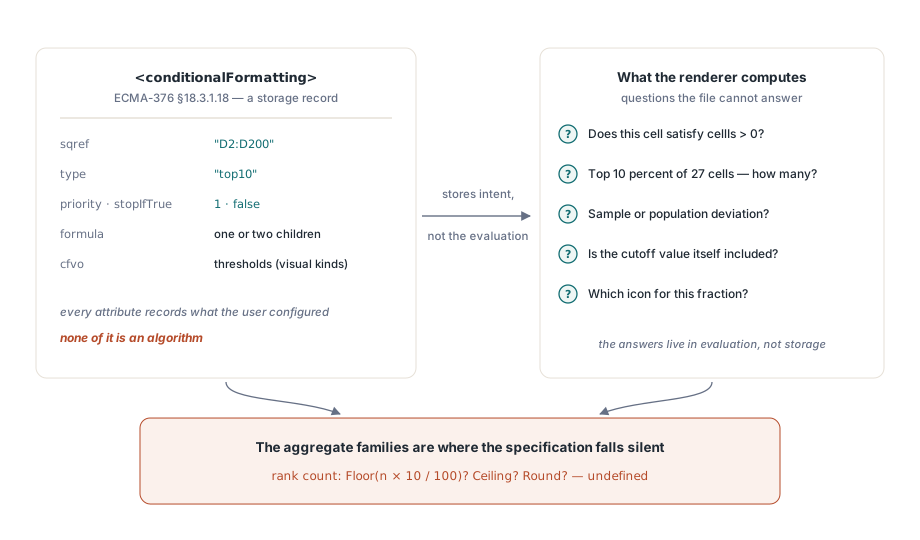
The short answer is that ECMA-376 and ISO 29500-1 define storage, not evaluation. A conditionalFormatting element (§18.3.1.18) carries an sqref and a list of cfRule children (§18.3.1.10), and each rule carries a type, an optional operator, a priority, a stopIfTrue flag, one or two formula children, and for the visual families a set of cfvo thresholds. Every one of those faithfully describes what the user configured, and none of them is an algorithm. For half the rule types that gap does not matter: cellIs with operator="greaterThan" means greater than, and containsText means the substring is present. The gap opens on the aggregate families. A top10 rule with rank="10" and percent="1" over 27 populated numeric cells highlights how many cells? Two point seven is not a number. Round, floor, or ceiling — the specification is silent, and picking wrong means your PDF disagrees with the workbook the customer has open next to it
Single-cell rules and where TCondFormatRule.Evaluate stops
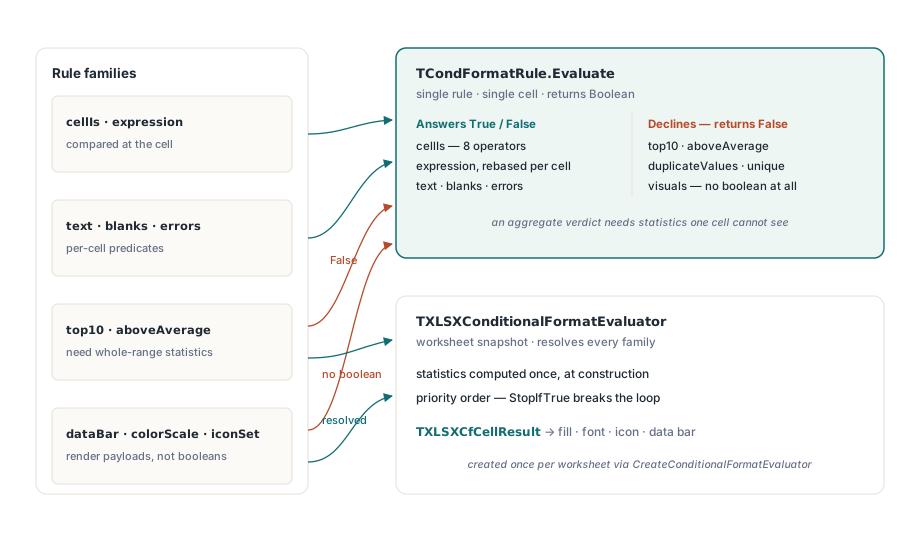
HotXLS took the cheap half first. TCondFormatRule.Evaluate in lxCondFormat.pas, added in 2.199.0, answers whether one rule fires for one cell without knowing anything about the rest of the range. It handles the eight BIFF comparison operators behind cellIs (between, notBetween, equal, notEqual, greater, less, greaterEqual, lessEqual), free-form expression rules evaluated at the cell so relative references rebase correctly, the four text predicates, and the blanks and errors predicates. Thresholds come from FFormula1 and FFormula2 resolved through TXLSCalculator.GetRangeValue at the cell position, and reversed between bounds are swapped rather than rejected
var
  I: Integer;
  Rule: TCondFormatRule;
  Value: Variant;
begin
  Value := Sheet.Cells[Row, Col].Value;
  for I := 0 to CondFormat.RuleCount - 1 do
  begin
    Rule := CondFormat.Rule(I);
    // Single-cell verdict only. Aggregate and visual kinds answer False.
    if Rule.Evaluate(Calculator, SheetIndex, Row, Col, Value) then
      ApplyHighlight(Row, Col, Rule.Style);
  end;
end;
The honest part of that method is what it refuses to guess. top10, aboveAverage, belowAverage, duplicateValues and uniqueValues return False, not because they are hard but because they are undecidable from one cell — every one of them needs a statistic over the whole domain. The four visual families, dataBar, colorScale2, colorScale3 and iconSet, return False for a different reason: they never produce a boolean at all, they produce a rendering payload, and a Boolean return type is the wrong shape for them
How does a worksheet-level evaluator avoid rescanning the sheet?
By computing every shared quantity once, at construction, and never again. TXLSXConditionalFormatEvaluator in lxHandleX.pas is an immutable snapshot for one worksheet, built through TXLSXWorksheet.CreateConditionalFormatEvaluator, and its whole design is a defense against the naive implementation where every painted cell triggers a full-range scan
Four things happen in the constructor. Each distinct multi-area sqref is parsed exactly once into a TXlsxCfRangeSnapshot, so ten rules sharing one range share one parse and one statistics pass. That pass streams mean, population deviation, minimum and maximum over the populated cells in a single walk, and only retains an ordered numeric array when a Top/Bottom or percentile rule actually needs order statistics. Duplicate and unique keys are built Unicode-safe and batch-sorted once instead of per lookup. Then the row axis is cut into bands at every area boundary, so EvaluateCell binary-searches a band and only visits rules whose ranges can possibly reach that row
The fourth is the one that matters most at scale. A relative rule formula such as =A1>AVERAGE($A$1:$A$100) means something different in every cell of the domain, and the obvious implementation compiles a fresh syntax tree per cell. TXlsxCfRulePlan compiles it once and re-evaluates the same tree through reversible coordinate offsets, which preserves Excel anchor behavior without a syntax-tree allocation per cell. Rules are then layered by priority, and a match on a rule whose StopIfTrue is set breaks the loop, exactly as Excel short-circuits
var
  Evaluator: TXLSXConditionalFormatEvaluator;
  Res: TXLSXCfCellResult;
begin
  Evaluator := Sheet.CreateConditionalFormatEvaluator;
  try
    if Evaluator.EvaluateCell(Row, Col, Res) then
    begin
      if Res.HasFillColor then
        Canvas.Brush.Color := TColor(Res.FillColor);
      if Res.HasIcon then
        // IconIndex is zero-based inside Res.IconSetType
        DrawIcon(Res.IconSetType, Res.IconIndex, Res.IconCount);
      if Res.HasDataBar then
        // DataBarAxis and DataBarEnd are normalised to 0..1
        DrawBar(Res.DataBarAxis, Res.DataBarEnd, Res.DataBarColor);
      if not Res.ShowCellValue then
        Exit;  // showValue="0" on the rule hides the number
    end;
  finally
    Evaluator.Free;
  end;
end;
How does Excel actually round a Top 10 percent rule?
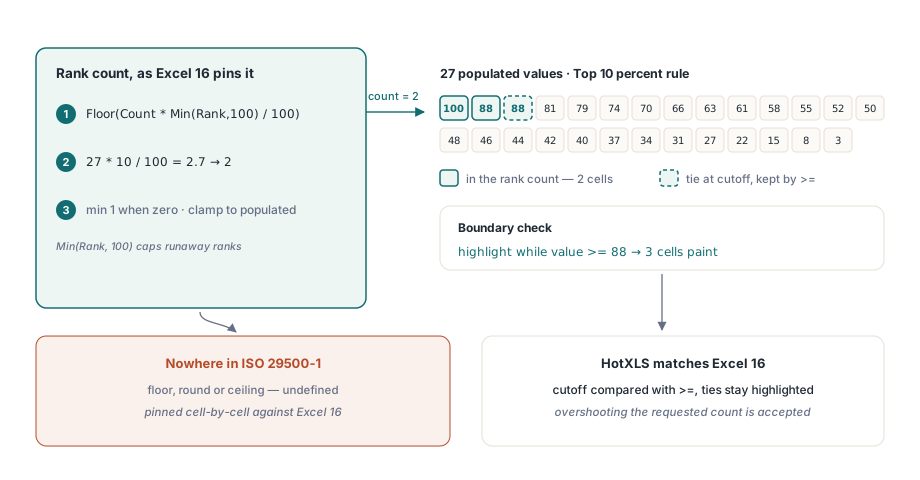
It floors, with a minimum of one, and it includes ties at the cutoff. That is not written down anywhere in ISO 29500-1 — it was pinned by probing Excel 16 with hand-built workbooks and reading back which cells the application highlighted. HotXLS implements exactly that: the rank count is Floor(Count * Min(Rank, 100) / 100), raised to 1 when it lands at zero, clamped to the populated count, and the cutoff value is then compared with >= so every cell equal to the boundary is highlighted even when that overshoots the requested count. Twenty-seven values and a 10 percent rule highlight two cells, plus any further cells tied with the second
Above-average rules hid a second ambiguity: aboveAverage with stdDev="1" selects cells one standard deviation above the mean, but sample and population deviation differ by the Bessel correction and they disagree visibly on small ranges, which is exactly where conditional formatting gets used. Excel 16 uses the population deviation, and HotXLS matches it, with the equalAverage flag turning the strict comparison inclusive only when no deviation band is in play. Duplicate and unique rules turned on key identity instead. If one cell holds the number 100 and another holds the text "100", Excel treats them as the same duplicate key, so HotXLS normalizes numeric text into the numeric key space rather than comparing raw strings. Blank cells are the mirror case: a true empty cell participates in the range tally but is not itself styled, so the empty cells in a column do not all light up as duplicates of each other
Color scales and icon sets: interpolation and boundary rules
The visual families resolve to render-ready numbers rather than booleans, and their edge behavior was pinned the same way. For a color scale with explicit numeric thresholds, HotXLS clamps the position fraction to the closed interval zero to one, then interpolates per channel with truncation rather than rounding — a value below the minimum stop gets the minimum color rather than an extrapolated one, a three-stop scale picks its pair by comparing against the midpoint stop, and a degenerate scale whose two ends carry the same threshold collapses to the top color instead of dividing by zero. Icon sets needed the opposite kind of care, because each cfvo after the first carries its own comparison strictness: HotXLS reads ThresholdEqualsInclude per threshold and applies >= or > accordingly, walking upward so the highest satisfied threshold wins the icon index. A reversed set flips the resolved index rather than the thresholds, per-icon overrides can pull a glyph from a different family, and any invalid threshold aborts the rule instead of producing a plausible-looking wrong icon
Feeding a grid, an HTML export and a PDF from one result
Because EvaluateCell returns a fully resolved TXLSXCfCellResult — differential fill and font color with theme tint already applied, bold, italic, underline, number format id, directional positive and negative bar extents, axis position, icon family and index — every consumer reads the same record and none of them needs to understand rule internals. HotXLS uses that one path for HTML export, PDF export and the interactive viewer, which is the only practical way to keep three renderers from drifting apart. Version 2.210.0 wired it into TXLSWorkbookViewer, which caches one prepared evaluator per active worksheet and reuses it across scrolling, selection and repaint, releasing it when the workbook or worksheet changes — rebuilding the snapshot on every Paint would defeat the entire construction-time design. That cache is also why TXLSWorkbookViewer.RefreshConditionalFormats exists: the snapshot is immutable, so if you mutate the attached workbook in place the aggregate statistics and resolved thresholds are stale until you call it
// Editing behind a live viewer: the cached snapshot must be invalidated.
Sheet := Viewer.XlsxWorkbook.Sheets[1];
Sheet.Cells[5, 2].Value := 4200;         // changes mean, min, max, ranking
Viewer.RefreshConditionalFormats;        // drop evaluator, repaint
What the evaluator will not do for you
Three boundaries are worth stating plainly. The classic single-cell TCondFormatRule.Evaluate and the worksheet-level TXLSXConditionalFormatEvaluator are different surfaces with different capabilities, and the single-cell one deliberately declines the aggregate and visual families rather than approximating them — if you need Top/Bottom or a color scale, build the evaluator. Relative date periods depend on the machine clock at evaluation time, so a timePeriod rule renders differently in a PDF generated today and one generated next week, which is correct behavior and still a support ticket waiting to happen if your archive is expected to be byte-stable. The third is grammatical rather than technical: the conditional-format formula grammar prohibits structured table references, so a rule cannot address a table column by name the way a worksheet formula can, and that is a constraint of the format rather than of the implementation
If you are building report output, an export pipeline or a custom grid that has to agree with Excel cell for cell, the same resolved result also drives the custom VCL spreadsheet grid described elsewhere on this blog. Full API documentation, the rule model and trial downloads for the HotXLS Delphi spreadsheet component are available on the product page