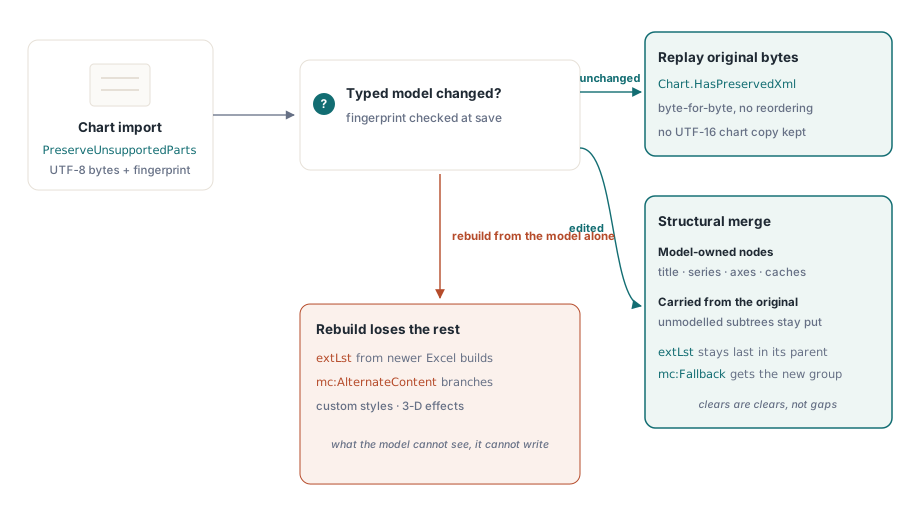
HotXLS keeps the original ChartML of an imported Excel chart and replays it byte for byte when nothing in the typed model changed, so opening and resaving a workbook does not quietly strip the parts of a chart the object model does not represent. Edit a title, a series or an axis and HotXLS structurally merges the new typed nodes into the original tree rather than regenerating the chart from scratch
That distinction — replay when untouched, merge when edited — is what makes a Delphi application safe to point at charts an analyst built in Excel. Regenerating a chart from a typed model always loses whatever the model does not know about, and Excel charts are full of things a library does not know about: custom styles, extension lists, alternate content branches, namespace-qualified formatting from add-ins
Why does resaving a workbook flatten its charts?
Because the usual implementation reads what it understands and writes what it understands. Everything in between — an extLst from a newer Excel build, an mc:AlternateContent branch, a shape effect the model has no property for — exists in the file, has no home in the object model, and disappears at save time. The user sees a chart that lost its gradient, its custom data labels or its 3D effect, and the workbook cannot explain why
With PreserveUnsupportedParts enabled on the workbook, HotXLS stores the original UTF-8 chart bytes on import along with a length and a 64-bit fingerprint of the modeled content. If the typed model has not changed by save time, it writes the original bytes back. No XML reordering, no whitespace drift, no resident UTF-16 copy of the chart hanging around in memory for a chart nobody edited
var
  Workbook: TXLSXWorkbook;
  Chart: TXLSXChart;
begin
  Workbook := TXLSXWorkbook.Create;
  try
    Workbook.PreserveUnsupportedParts := True;   // set before Open
    Workbook.Open('quarterly-review.xlsx');
    Chart := Workbook.Sheets[1].Charts[0];   // Sheets[] is 1-based
    if Chart.HasPreservedXml then
      Log('original ChartML retained; untouched charts replay exactly');
    Chart.Title := 'Revenue by region, Q3 2026';  // now the merge path runs
    Workbook.SaveAs('quarterly-review-out.xlsx');
  finally
    Workbook.Free;
  end;
end;
What the merge keeps and what the model owns
The rule is ownership. Public model nodes — title, series, caches, plot groups, axes — are decided by the newly generated tree. Unmodelled subtrees are carried over from the original. That asymmetry is deliberate, and it is the part that takes a moment to internalize: deleting a series must not resurrect the old series from the preserved XML, so anything the model owns is taken from the model even when the model says "gone"
Unowned content is reinserted next to the matched nodes it sat beside, and extLst stays last within its parent because that is where the schema requires it. Clearing a known property — removing a bold flag, dropping a color — is treated as a clear, not as a gap to be filled from the original tree. Unknown attributes in the same neighbourhood keep their place
Markup-compatibility content gets specific handling. On parse, HotXLS skips mc:Choice and reads mc:Fallback; if that fallback branch wraps a plot group the model knows, the merge writes the new typed content back into the fallback subtree. Without that step a save would emit the new plot group and leave the old one inside the fallback, and the chart would carry two
Opting one chart out
ClearPreservedXml drops the original XML and fingerprint for one chart, so the next save rebuilds that chart purely from the typed model. It is a per-chart decision; the workbook-level PreserveUnsupportedParts still governs whether preservation state is built at import
Reach for it when you want a clean chart rather than a faithful one — for example when a template chart carries formatting from an old corporate theme and the point of the operation is to discard it. Do not reach for it as a debugging reflex: a chart that renders wrong after an edit is more often a modeling question than a preservation question, and clearing the preserved XML destroys the evidence
Combination charts and the second axis
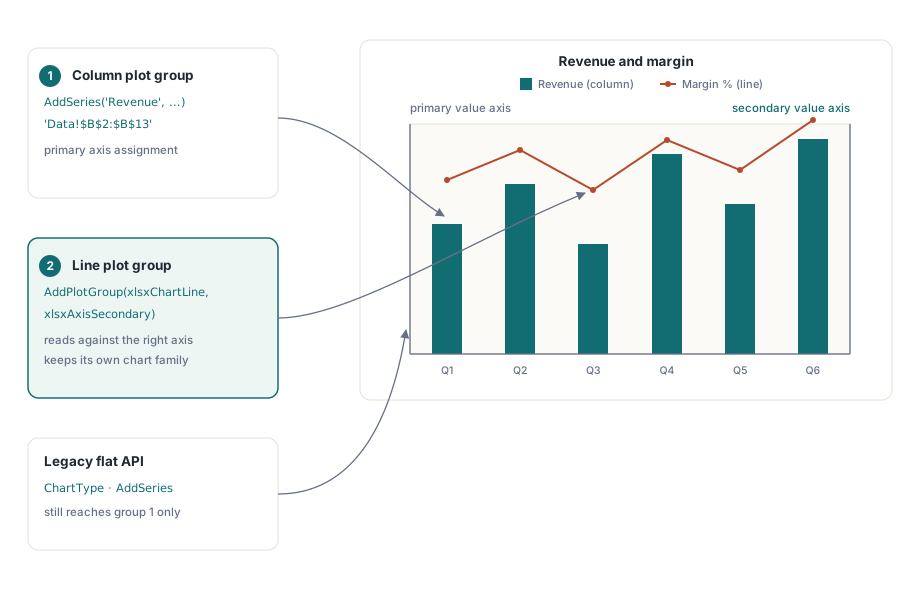
AddPlotGroup builds ordered combination charts, where each plot group keeps its own chart family and its own primary or secondary axis assignment. That is what the ubiquitous business chart needs: revenue as columns on the left axis, margin percentage as a line on the right
Charts expose primary and secondary category and value axes plus a series axis, with typed category, value, date and series-axis settings covering positions, identifiers, crossings, date units, label intervals and visibility. The older flat API — ChartType, AddSeries, the flat Series collection — still addresses the primary plot group, so existing code keeps working while the model underneath holds every ordered group
var
  Chart: TXLSXChart;
  Line: TXLSXChartPlotGroup;
begin
  // Column chart anchored over rows 1..15, columns 5..12
  Chart := Sheet.Charts.Add(xlsxChartColumn, 'Revenue and margin',
    1, 5, 15, 12);
  Chart.AddSeries('Revenue', 'Data!$A$2:$A$13', 'Data!$B$2:$B$13');
  // Second plot group: a line, read against the secondary value axis
  Line := Chart.AddPlotGroup(xlsxChartLine, xlsxAxisSecondary);
  Line.AddSeries('Margin %', 'Data!$A$2:$A$13', 'Data!$C$2:$C$13');
end;
Before this model existed, opening and resaving a combination chart collapsed it into one chart family and lost the secondary, date and series axes. Chart formula references and cached series values now survive workbook copies and open/save cycles as well, and chart anchors are matched to their chart parts by relationship identifier — so an application that reorders relationship entries no longer swaps chart contents between worksheet positions
The manual layout trap
If you position a plot area, title, axis title or legend by hand, write all four coordinates. Office requires x, y, w and h as a complete group whenever any one of them is present, and ignores the entire manualLayout otherwise. HotXLS always emits the full rectangle for that reason, and SetPositionAndSize sets and enables it in one call
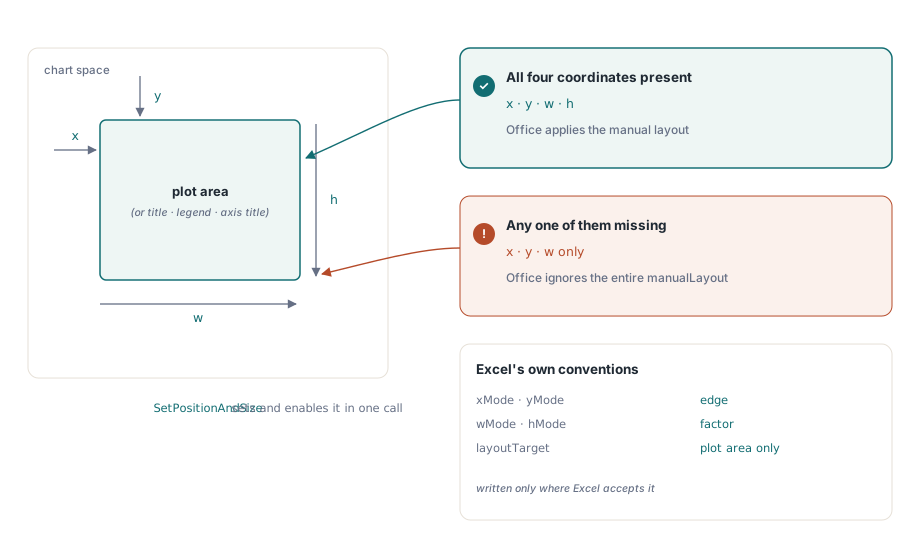
Two more details follow Excel rather than the specification's full latitude. Position is written with xMode and yMode set to edge while size uses factor for wMode and hMode, because that is what Excel writes and what it converts other combinations into. And layoutTarget is emitted only for the plot area, never for titles or legends, where the Microsoft implementation notes forbid it
Fitting this into a workbook round trip
Chart preservation is one instance of a general policy: a library that edits documents authored elsewhere should change what it was asked to change and nothing else. The same reasoning drives HotXLS on themes, calculation chains and worksheet extensions, described in the notes on lossless round trips for theme, extLst and calcChain, and on VBA projects and external links in preserving VBA and external links. For the chart-authoring surface itself — creating charts, placing images and drawings from Delphi — see the walkthrough of charts, images and drawings in HotXLS
HotXLS reads, edits and writes XLSX charts from native Delphi and C++Builder code with no Excel installation on the machine, which is what makes fidelity a library problem rather than an automation problem — the HotXLS Delphi spreadsheet component page has the chart feature list and a trial download