After a generator rewrites the chart, labels that should show column C come back as bare numbers, or one bar reads S1; 2; 20 instead of 20.0, yet Excel opens the file without complaint. Value From Cells labels sit in an Office 2013 chart extension, which HotXLS writes through TXLSXChartSeries.DataLabelsRange with complete per-point label settings in schema order
Where Excel keeps Value From Cells labels
The ECMA-376 chart schema (Part 1, §21.2) has no element that means "take this label's text from a worksheet range". Its CT_DLbls type, the <c:dLbls> block inside a series, holds any number of single-point <c:dLbl> overrides, followed by either <c:delete> or the shared label group, with an extension list at the end. The shared group is a fixed sequence: numFmt, spPr, txPr, dLblPos, showLegendKey, showVal, showCatName, showSerName, showPercent, showBubbleSize, separator, showLeaderLines, leaderLines. Nearly every checkbox in Excel's Format Data Labels pane maps onto one of those elements. Value From Cells does not. Excel 2013 added it on top of the standard through extension lists in the c15 namespace (http://schemas.microsoft.com/office/drawing/2012/chart), which Microsoft documents in [MS-ODRAWXML], so a reader built strictly from the ECMA-376 schema sees nothing there but opaque <c:ext> elements. Stripped to the parts that matter, a series with cell-range labels looks like this:
<c:ser>
  <c:idx val="0"/><c:order val="0"/>
  <c:tx>...</c:tx>
  <c:dLbls>
    <!-- zero or more <c:dLbl> point overrides lead the block -->
    <c:showLegendKey val="0"/>
    <c:showVal val="1"/>
    <c:showCatName val="0"/>
    <c:showSerName val="0"/>
    <c:showPercent val="0"/>
    <c:showBubbleSize val="0"/>
    <c:extLst>
      <c:ext uri="{CE6537A1-D6FC-4f65-9D91-7224C49458BB}"
             xmlns:c15="http://schemas.microsoft.com/office/drawing/2012/chart">
        <c15:showDataLabelsRange val="1"/>
      </c:ext>
    </c:extLst>
  </c:dLbls>
  <c:cat>...</c:cat>
  <c:val>...</c:val>
  <c:extLst>
    <c:ext uri="{02D57815-91ED-43cb-92C2-25804820EDAC}"
           xmlns:c15="http://schemas.microsoft.com/office/drawing/2012/chart">
      <c15:datalabelsRange>
        <c15:f>Sales!$C$1:$C$3</c15:f>
        <c15:dlblRangeCache>
          <c:ptCount val="3"/>
          <c:pt idx="0"><c:v>Target met</c:v></c:pt>
          ...
        </c15:dlblRangeCache>
      </c15:datalabelsRange>
    </c:ext>
  </c:extLst>
</c:ser>
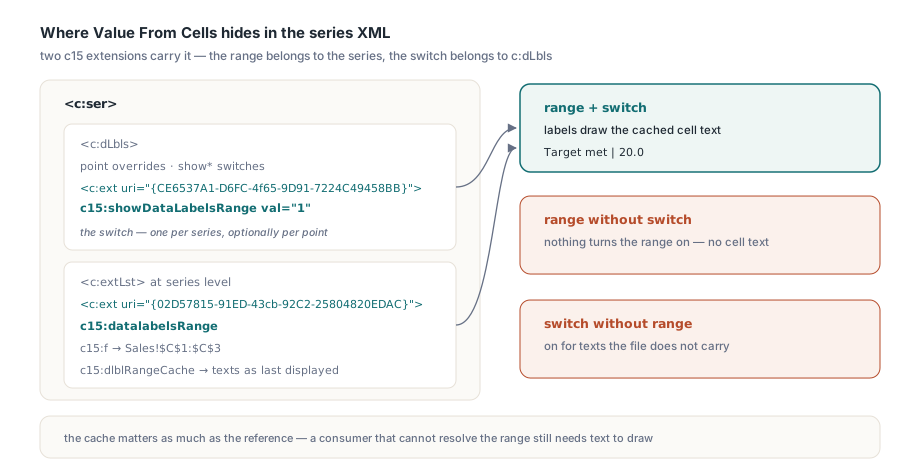
The feature is split across two places. The range belongs to the series: the series-level extension with URI {02D57815-91ED-43cb-92C2-25804820EDAC} carries c15:datalabelsRange, whose c15:f holds the reference and whose c15:dlblRangeCache holds the label texts as they were displayed when the file was saved. The switch belongs to the labels: c15:showDataLabelsRange sits in an extension with URI {CE6537A1-D6FC-4f65-9D91-7224C49458BB} at the end of <c:dLbls>, and the same extension can close an individual <c:dLbl> to turn the range text on or off for one point
Each half fails on its own. A file with the range but no switch shows no cell text, and a file with the switch but no range has nothing to show. A program that models only what §21.2 defines loses both when it regenerates the chart part, which is why HotXLS keeps unmodeled ChartML through an edit. The cache matters as much as the reference: a consumer that cannot resolve the range, for instance one pointing into another workbook, still needs text to draw
Setting the label range on a series
In HotXLS the range is a property of the series. Assigning TXLSXChartSeries.DataLabelsRange also switches ShowDataLabelsRange on and marks it as explicitly set, because a range without the switch would never be displayed, and assigning an empty string switches it off again. The cell text combines with the ordinary switches (ShowValue, ShowCategoryName, ShowSeriesName, ShowPercent, ShowLegendKey, ShowBubbleSize), joined by Separator, while LabelNumFmt formats the value part. A trendline's equation label is not part of this block; it lives inside <c:trendline> and follows Excel's own rules for trendline equation text. When the chart is saved, ResolveDataLabelsRange refreshes DataLabelsCache from the formatted text of the cells, skipping hidden rows and columns when the chart plots visible cells only; a range into another workbook keeps the cache it was opened with. Workbook and chart creation follow the usual HotXLS chart pattern: a new workbook has no sheet until you add one, and Sheets.Items counts from 1
uses
  lxHandleX;

procedure BuildRevenueChart(const FileName: WideString);
var
  Book: TXLSXWorkbook;
  Sheet: TXLSXWorksheet;
  Chart: TXLSXChart;
  Series: TXLSXChartSeries;
begin
  Book := TXLSXWorkbook.Create;
  try
    Sheet := Book.Sheets.Add('Sales');
    Sheet.Cells[1, 1].Value := 'East';
    Sheet.Cells[1, 2].Value := 18.25;
    Sheet.Cells[1, 3].Value := 'Target met';
    Sheet.Cells[2, 1].Value := 'Central';
    Sheet.Cells[2, 2].Value := 20;
    Sheet.Cells[2, 3].Value := 'Restated';
    Sheet.Cells[3, 1].Value := 'West';
    Sheet.Cells[3, 2].Value := 14.6;
    Sheet.Cells[3, 3].Value := 'Below plan';

    Chart := Sheet.AddChart(xlsxChartBar, 'Revenue by region', 1, 5, 16, 12);
    Series := Chart.AddSeries('Revenue', 'Sales!$A$1:$A$3', 'Sales!$B$1:$B$3');

    // Also sets ShowDataLabelsRange := True and records it as set
    Series.DataLabelsRange := 'Sales!$C$1:$C$3';
    Series.ShowValue := True;           // cell text plus the value
    Series.Separator := ' | ';
    Series.LabelNumFmt := '0.0';        // value part reads 20.0, not 20
    Series.LabelPos := xlsxDlblPosOutEnd;

    Book.SaveAs(FileName);
  finally
    Book.Free;
  end;
end;
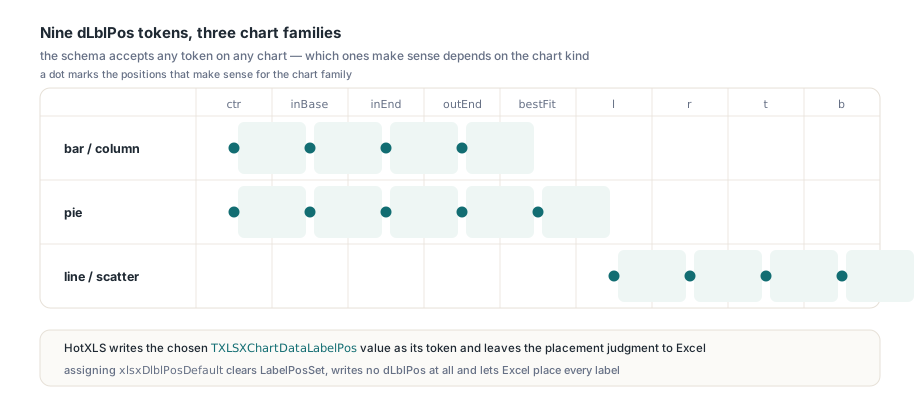
The schema's ST_DLblPos enumeration lists nine position tokens and accepts any of them on any chart, so a validator has no objection to outEnd on a line series. Which positions make sense depends on the chart kind: bar and column series take ctr, inBase, inEnd and outEnd, pie charts add bestFit, and line and scatter series use l, r, t and b. HotXLS writes the chosen TXLSXChartDataLabelPos value as its token and leaves the judgment to Excel, so LabelPos should come from the subset that belongs to your chart type. Assigning xlsxDlblPosDefault clears LabelPosSet, writes no dLblPos at all, and lets Excel place the labels itself. For the example above, Expected: each bar labeled outside its end with its cell text and its value to one decimal, the two parts joined by |
What does a single-point label have to repeat?
Everything the series label says. The schema makes a point override look cheap: CT_DLbl is an idx, followed by either delete or a label group (an optional layout and tx ahead of the same numFmt-through-separator run) and an optional extension list, and every member of the group is optional. A <c:dLbl> holding nothing but idx and the showDataLabelsRange extension is therefore schema-valid. Excel renders such a label as S1; 2; 20 instead of 20.0: it treats each omitted show* switch as on, so the series name and category appear, and it does not inherit the series number format. A point label replaces the series label for that point rather than patching it, which is why the point labels Excel itself writes carry the complete set of switches. A generator that emits minimal overrides to keep the XML small passes validation and still shows the wrong text
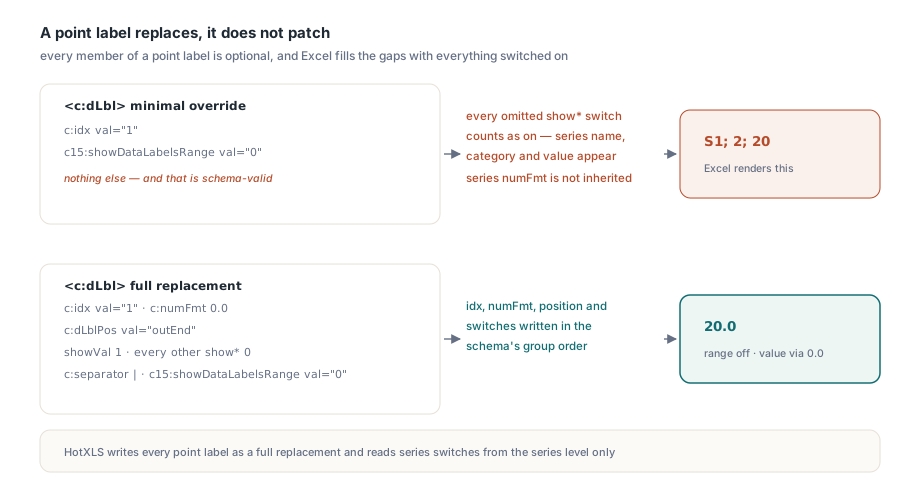
HotXLS writes every point label as a full replacement. SetPointShowDataLabelsRange(APointIndex, AVisible) records an on or off value for the range text on one point, keyed by the 0-based point index that becomes idx. At save time each such point gets one <c:dLbl>: idx, the series number format, position and switches in group order, and last the {CE6537A1-…} extension carrying that point's value. SetPointLabelText(APointIndex, AText) adds literal text through <c:tx>; an index with text, a range override and a preserved layout still gets a single <c:dLbl>. On reading, the series switches are taken from the series level, so the copies inside point labels never overwrite them. The code below sets two overrides on the revenue series, and the XML after it is the label expected for point 1
procedure OverridePoints(Series: TXLSXChartSeries);
var
  I: Integer;
  Visible: Boolean;
begin
  // Second bar (idx 1): show the value only, without the cell text
  Series.SetPointShowDataLabelsRange(1, False);
  // Third bar (idx 2): replace the whole label with literal text
  Series.SetPointLabelText(2, 'Q3 pending audit');

  for I := 0 to Series.DataLabelRangeOverrideCount - 1 do
    Writeln('point ', Series.DataLabelRangeOverrideIndexes[I],
      ' range text: ', Series.DataLabelRangeOverrideValues[I]);

  if Series.TryGetPointShowDataLabelsRange(0, Visible) then
    Writeln('point 0 has its own override')
  else
    Writeln('point 0 follows ShowDataLabelsRange = ',
      Series.ShowDataLabelsRange);
end;
<!-- Expected XML for point 1 -->
<c:dLbl>
<c:idx val="1"/>
<c:numFmt formatCode="0.0" sourceLinked="0"/>
<c:dLblPos val="outEnd"/>
<c:showLegendKey val="0"/>
<c:showVal val="1"/>
<c:showCatName val="0"/>
<c:showSerName val="0"/>
<c:showPercent val="0"/>
<c:showBubbleSize val="0"/>
<c:separator> | </c:separator>
<c:extLst>
<c:ext uri="{CE6537A1-D6FC-4f65-9D91-7224C49458BB}"
xmlns:c15="http://schemas.microsoft.com/office/drawing/2012/chart">
<c15:showDataLabelsRange val="0"/>
</c:ext>
</c:extLst>
</c:dLbl>Excel opening a chart proves little about its XML
Excel opens charts whose children are out of order, even with unknown elements inside <c:dLbls>, and reads their properties back correctly; an illegal attribute value such as val="banana" is what makes Workbooks.Open fail. Other consumers are less lenient. The Open XML SDK's OpenXmlValidator reports out-of-order children as schema errors, and tools that bind the schema strictly reject them, so a chart that "works in Excel" can still break a downstream pipeline. Validate generated chart parts with OpenXmlValidator; a double-click in Excel tells you only that Excel coped. These are the ordering rules from the §21.2 schema that are easiest to get wrong:
- In
<c:dLbls>, point overrides lead, the shared group follows andextLstcloses the block; inside the groupdLblPosprecedes everyshow*switch andshowLegendKeyprecedesshowVal - Inside a point label,
layoutandtxfollowidxand come beforenumFmt; the point's extension list closes it - A bar series runs
idx,order,tx,spPr,invertIfNegative,pictureOptions,dPt,dLbls,trendline,errBars,cat,val,shape,extLst; a line series hasmarkerwhere the bar series hasinvertIfNegativeandpictureOptions, andsmoothwhere it hasshape - Scatter, area and bubble series keep the same skeleton (labels, trendlines, error bars and data, in that order) with their own members:
xValandyValfor scatter and bubble data, andbubbleSizeandbubble3Dafter the data in a bubble series - The usual series-level slips are data references written before
dLbls,errBarsahead oftrendline, andsmoothahead of the data, none of which Excel complains about
Manual label positions go on a point label
Layout is where intuition and the schema part ways. When a user drags a label in Excel, the manual position is stored as <c:layout> inside that label's <c:dLbl>, directly after idx. CT_DLbls has no layout child, so a generator that writes one directly under <c:dLbls>, expecting it to position the whole set, produces a file the validator flags as an invalid child. Excel opens that file and does something nobody asked for: it applies the layout to the first label only, putting it where an idx 0 point layout would put it, and misreads the widths of the remaining labels, so a label width of 37.7 comes back as 52.3. The chart looks almost right, which makes the mistake easy to miss in review
A layout copied out of an extension can make the whole workbook unreadable. Excel can also keep a c15:layout inside a label's extension list, and the c15 prefix is declared on the enclosing <c:ext>, not on the fragment. Code that finds layouts by local name picks up that element too, and pasting it into <c:dLbls> carries the prefix without its declaration, so the rebuilt chart part contains an undeclared namespace prefix and no namespace-aware XML parser will load it. Match layouts by namespace and by position as a direct child, never by local name alone
HotXLS takes a label layout only from a direct <c:layout> child of <c:dLbls> or of a <c:dLbl>, never from inside an extension, and keeps it verbatim keyed by point index. LabelLayoutXml holds the first label's layout, including a stray one found directly under <c:dLbls>, since that is how Excel interprets it; PointLabelLayoutCount, PointLabelLayoutIndexes and PointLabelLayoutXmls list the rest. When the chart is regenerated, that layout goes on the idx 0 <c:dLbl> and every other layout on the <c:dLbl> of its own index, each merged with that point's range override and text into one label
procedure ReportLabelLayouts(const FileName: WideString);
var
  Book: TXLSXWorkbook;
  Sheet: TXLSXWorksheet;
  Series: TXLSXChartSeries;
  C, S, I: Integer;
begin
  Book := TXLSXWorkbook.Create;
  try
    if Book.Open(FileName) <> 1 then
      Exit;
    Sheet := Book.Sheets[1];               // 1-based sheet index
    for C := 0 to Sheet.Charts.Count - 1 do
      for S := 0 to Sheet.Charts[C].SeriesCount - 1 do
      begin
        Series := Sheet.Charts[C].Series[S];
        Writeln('chart ', C, ' series ', S,
          ' label range: ', Series.DataLabelsRange,
          ' cached texts: ', Series.DataLabelsCache.Count);
        if Series.LabelLayoutXml <> '' then
          Writeln('  first label has a manual layout');
        for I := 0 to Series.PointLabelLayoutCount - 1 do
          Writeln('  point ', Series.PointLabelLayoutIndexes[I],
            ' layout: ', Series.PointLabelLayoutXmls[I]);
      end;
  finally
    Book.Free;
  end;
end;
Excel reads a point label as a whole label, so writing it as one, with the manual position on the same <c:dLbl>, keeps both the S1; 2; 20 text and the shifted first label out of your charts. In HotXLS, that model sits behind DataLabelsRange, the point override calls and the preserved layout properties