HotXLS renders Excel chart date axes with calendar arithmetic, not fixed day counts. The TXLSChartDateAxisTransform class in the lxChart unit keeps every coordinate as a workbook serial, computes each month or year tick directly from the axis minimum through IncMonth and IncYear, and clamps month ends to the real calendar, so a series anchored on January 31 gets ticks on February 28, March 31 and April 30 instead of sliding. The same transform picks day, month or year units automatically and is shared by the HTML, SVG and paginated PDF chart renderers
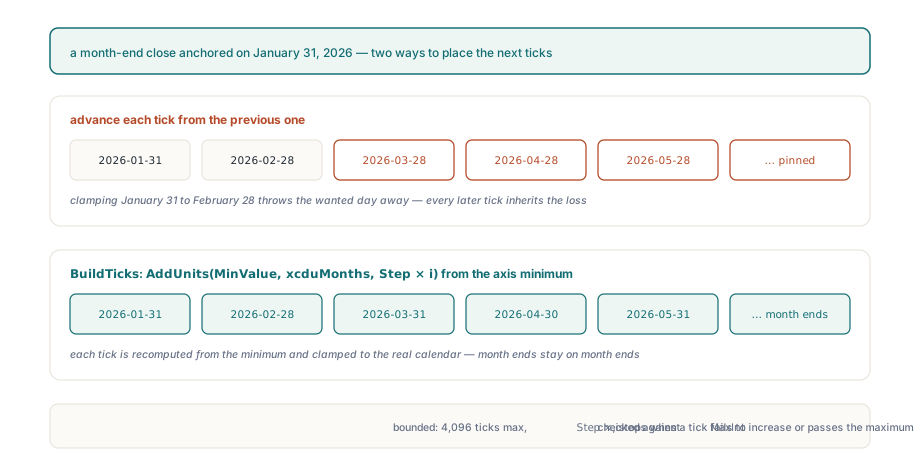
The bug this prevents is familiar to anyone who has charted a month-end close. A renderer that treats a month as 30 days drifts five days early by the end of the first year. A renderer that is smarter and uses calendar months, but advances each tick from the previous one, fails more quietly: January 31 becomes February 28, the next step lands on March 28, and every tick after that stays pinned to the 28th. The chart looks plausible, the labels are wrong, and nobody notices until a controller asks why the March balance is plotted three days before quarter end
Why do month ticks drift when they are accumulated?
Month ticks drift because clamping throws information away. Once January 31 has been clamped to February 28, the fact that the series wanted the 31st is gone, and any step taken from the clamped value inherits the loss. TXLSChartDateAxisTransform.BuildTicks never steps from a previous tick. Tick i is always computed as AddUnits(MinValue, UnitKind, Step * i, ...), which is min + unit × index measured from the axis minimum. AddUnits adds the count straight to the serial for day units and, for month and year units, converts the serial to a real date, calls IncMonth or IncYear, and converts back. The loop is also bounded on every side: the result array is capped at 4096 entries whatever the caller requests, Step * i is checked against MaxInt before it is multiplied, and generation stops as soon as a tick fails to increase or passes the axis maximum
uses
  SysUtils, lxChart;

var
  Ticks: TXLSChartDateValues;
  MinSerial, MaxSerial: Double;
  I, Count: Integer;
begin
  // 1900 date system (Dates1904 = False), month-end anchored series
  MinSerial := TXLSChartDateAxisTransform.DateTimeToSerial(
    EncodeDate(2026, 1, 31), False);
  MaxSerial := TXLSChartDateAxisTransform.DateTimeToSerial(
    EncodeDate(2026, 12, 31), False);

  // One-month step, aim for 12 ticks, never more than 64
  Count := TXLSChartDateAxisTransform.BuildTicks(MinSerial, MaxSerial,
    1, xcduMonths, False, 12, 64, Ticks);

  for I := 0 to Count - 1 do
    Writeln(TXLSChartDateAxisTransform.FormatValue(Ticks[I], False));
  // 2026-01-31, 2026-02-28, 2026-03-31, 2026-04-30 ... 2026-12-31
end;
There is one honest approximation in BuildTicks. When the requested step is zero, the method estimates a step size by treating a month as 30 days and a year as 365, then rounds the raw step to a 1, 2 or 5 multiple of a power of ten. That estimate only decides how many units lie between ticks. The tick positions themselves still come from IncMonth and IncYear, so the approximation can change the tick density but never moves a tick off the calendar
Why keep workbook serials instead of converting to TDateTime?
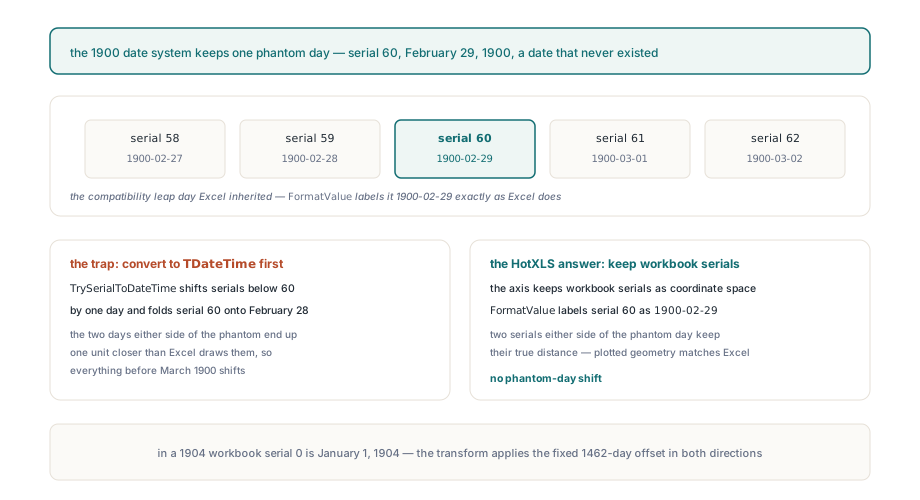
A date axis in HotXLS keeps workbook serials as its coordinate space because Delphi's TDateTime has no slot for serial 60, the phantom February 29, 1900 that the 1900 date system inherited as a compatibility quirk. TrySerialToDateTime shifts serials below 60 by one day and folds serial 60 onto February 28, which is fine for labelling a single point but fatal for geometry: convert every point to TDateTime first and the two days either side of the phantom day end up one unit closer together than Excel draws them, so everything plotted before March 1900 shifts relative to everything after it. TXLSChartDateAxisTransform.FormatValue special-cases the same slot and labels it 1900-02-29 exactly as Excel does. In a 1904 workbook, serial 0 is January 1, 1904, and the transform applies the fixed 1462-day offset in both directions; the full story of both epochs is in our article on Excel date serials, the 1904 system and number formats
How does HotXLS choose days, months or years automatically?
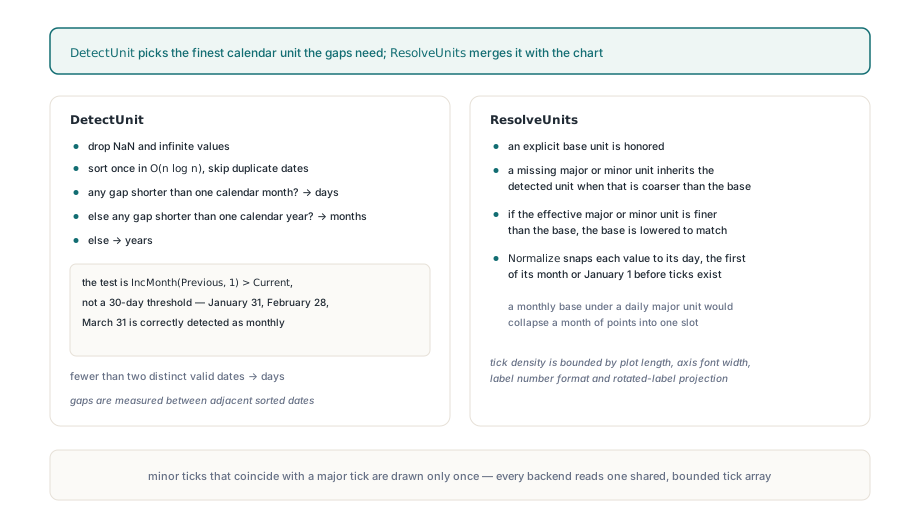
TXLSChartDateAxisTransform.DetectUnit chooses the finest calendar unit that the gaps in the data actually need. The method drops NaN and infinite values first, sorts the rest once in O(n log n), and skips duplicate dates. If any adjacent gap is shorter than one calendar month, the unit is days; otherwise, if any gap is shorter than one calendar year, the unit is months; otherwise it is years. The test is IncMonth(Previous, 1) > Current, not a 30-day threshold, so a month-end series running January 31, February 28, March 31 is correctly detected as monthly data. With fewer than two distinct valid dates there is no gap to measure, and the method falls back to days
ResolveUnits then merges the detected unit with whatever the chart declares. An explicit base unit is honoured, and a missing major or minor unit inherits the detected unit when that is coarser than the base. The last step is the one people miss: if the effective major or minor unit is finer than the base unit, the base is lowered to match. The base unit is what data points are normalised to before any ticks exist, with Normalize snapping a value to its day, the first of its month or January 1, so a monthly base under a daily major unit would collapse a month of points into one slot before the tick code ever saw them. Tick density is bounded as well, by the plot length, the measured width of the axis font, the label number format and the projection of rotated labels, and every backend draws labels, tick marks and gridlines from one shared, bounded tick array, with a minor tick that coincides with a major tick drawn only once
What does the dateAx element store, and what does omission mean?
In ChartML every calendar setting on a date axis is optional, and omitting one is not the same as writing its default value. The CT_DateAx type in ECMA-376 Part 1, §21.2 (DrawingML Charts) lets baseTimeUnit, majorTimeUnit, minorTimeUnit and auto each appear or not, and an omitted baseTimeUnit tells Excel to decide for itself, which is different from an explicit days. TXLSXChartAxis therefore stores each value next to a presence flag: BaseTimeUnit with BaseTimeUnitSet, MajorTimeUnit with MajorTimeUnitSet, MinorTimeUnit with MinorTimeUnitSet, and AutoDateAxis with AutoDateAxisSet. Assigning a value sets its flag, clearing the flag returns the element to omission, and the XLSX writer emits an element only when its flag is set. Note that auto means automatic category-versus-date detection, not automatic tick units
var
  Book: TXLSXWorkbook;
  Sheet: TXLSXWorksheet;
  Chart: TXLSXChart;
  Axis: TXLSXChartAxis;
  M: Integer;
begin
  Book := TXLSXWorkbook.Create;
  try
    Sheet := Book.Sheets.Add('Close');
    Sheet.Cells[1, 1].Value := 'Month end';
    Sheet.Cells[1, 2].Value := 'Balance';
    for M := 1 to 12 do
    begin
      Sheet.Cells[M + 1, 1].Value :=
        EncodeDate(2026, M, DaysInAMonth(2026, M));   // DateUtils
      Sheet.Cells[M + 1, 2].Value := 1000 + M * 75;
    end;

    Chart := Sheet.AddLineChart('Month-end balance',
      'Close!$A$2:$A$13', 'Close!$B$2:$B$13', 15, 1, 32, 9);
    Axis := Chart.CategoryAxis;
    Axis.Kind := xlsxAxisDate;                  // writes c:dateAx
    Axis.BaseTimeUnit := xlsxChartTimeDays;     // also sets BaseTimeUnitSet
    Axis.MajorTimeUnit := xlsxChartTimeMonths;
    Axis.MajorUnit := 1;                        // > 0 marks majorUnit as set
    Axis.NumberFormat := 'mmm yyyy';
    Axis.NumberFormatSourceLinked := False;
    Axis.TextStyle.Rotation := -45;             // degrees; stored as 1/60000
    // AutoDateAxis left untouched: no c:auto element is written

    Book.SaveAs('month-end-balance.xlsx');
  finally
    Book.Free;
  end;
end;
Labels and orientation follow the same presence-aware rules. The axis numFmt sits after the title and before the tick marks, its sourceLinked attribute defaults to true, and TXLSXChartAxis keeps the format code, the source-linked value and NumberFormatSet separately, so an empty code is never mistaken for an absent element. Text rotation is stored in 1/60000 of a degree with positive values meaning clockwise; TextStyle.Rotation takes plain degrees, the SVG output uses the angle as is, and the paginated backend, whose positive angles run counter-clockwise, flips the sign at one shared boundary. A reversed maxMin axis mirrors the major and minor ticks, gridlines, data points, trendlines and error bars together, and never just the labels. When you open a workbook written elsewhere, the flags tell you what the author actually specified
var
  Book: TXLSXWorkbook;
  Axis: TXLSXChartAxis;
begin
  Book := TXLSXWorkbook.Create;
  try
    if Book.Open('forecast.xlsx') <> 1 then
      raise Exception.Create('Cannot open workbook');
    Axis := Book.Sheets[0].Charts[0].CategoryAxis;
    if Axis.Kind = xlsxAxisDate then
    begin
      if Axis.BaseTimeUnitSet then
        Writeln('baseTimeUnit = ', Ord(Axis.BaseTimeUnit))
      else
        Writeln('baseTimeUnit omitted: Excel chooses at render time');
      if Axis.AutoDateAxisSet then
        Writeln('auto = ', Axis.AutoDateAxis);
    end;
  finally
    Book.Free;   // save it again and the omitted elements stay omitted
  end;
end;
Where does the calendar model stop?
The calendar model stops at formats that cannot express calendar units, and HotXLS does not pretend otherwise. ODF 1.2 offers chart:interval-major, which is a plain number with no notion of days, months or years, so an Excel monthly axis saved as ODS cannot carry its unit and HotXLS does not invent a non-standard attribute to fake one. On the legacy BIFF8 side, the AxcExt record holds nine fixed 16-bit words, and its automatic flags only mask fields rather than remove them; HotXLS preserves the masked minimum, maximum, interval, unit and crossing values on read and write-back, keeps unknown unit codes intact in the Classic model, and maps only the valid date units 0, 1 and 2 (days, months, years) to XLSX
Date axes are one layer of a chart model that also has to survive files it did not create. When an Excel workbook combines a date-axis line with a column series on a secondary axis, our article on preserved ChartML and combination charts shows how HotXLS replays the original chart XML byte for byte when nothing changed and merges typed edits into it when something did, and our overview of charts, images and drawings covers the anchoring and series APIs used above. All of it ships in the HotXLS Delphi Component for Delphi and C++Builder, which reads, writes and renders XLS and XLSX charts without Excel automation