A chart part saved by a current Excel build rarely stops at the elements the ECMA-376 chart schema defines. The chart space usually opens with an mc:AlternateContent block that offers c14:style to newer readers and a plain c:style to older ones, each series carries a c:extLst with a c16:uniqueId, and "Value From Cells" data labels live in yet another extension. A program that parses only what it models and regenerates the part at save time writes none of that back. Change one word in the title, reopen the file in Excel, and the labels that pulled their text from a cell range have vanished
The fix is to stop treating a save as a rebuild. Keep the bytes the chart arrived with, write them back unchanged when nothing modelled has moved, and when something has, merge the new elements into the original tree so that the unfamiliar parts stay where Excel put them
Replay the original ChartML when nothing changed
HotXLS does exactly that when TXLSXWorkbook.PreserveUnsupportedParts is True, which is the default on a freshly created workbook. On import, each chart keeps its original UTF-8 bytes together with the length and a 64-bit fingerprint of the content the typed model represents. At save time HotXLS regenerates the modelled part, compares length and fingerprint, and if both match it writes the stored bytes back verbatim: no element reordering, no whitespace drift, and no second UTF-16 copy of every untouched chart held in memory
Because the comparison runs on content, assigning a property the value it already holds makes no difference. TXLSXChart setters exit early on an equal value, so a loop that "refreshes" every chart title from a database row still replays every chart whose title was already correct. Line formatting on error bars and trendlines is tracked by its own change flag, and changing it always counts as an edit
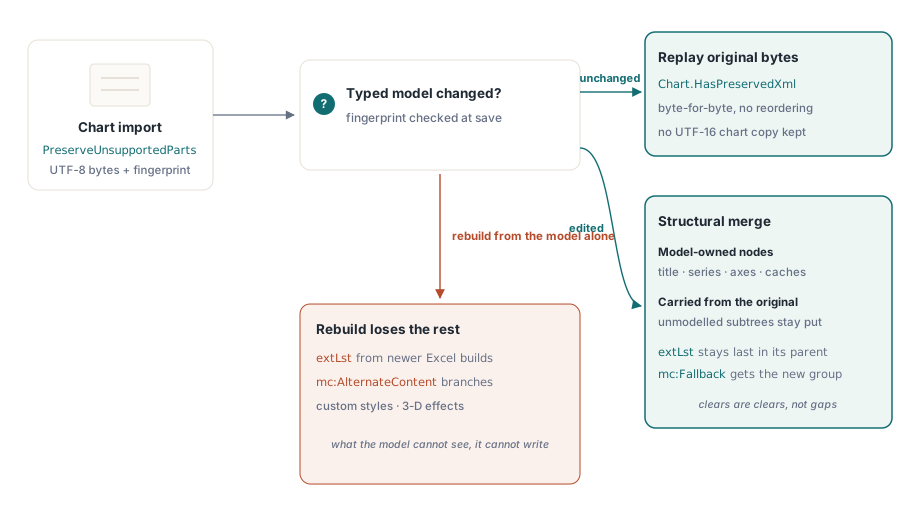
TXLSXChart.HasPreservedXml tells you which path a chart is on before you edit anything. It reports True when original ChartML is attached to the chart, which is the prerequisite for both the replay and the merge
var
  Workbook: TXLSXWorkbook;
  Chart: TXLSXChart;
begin
  Workbook := TXLSXWorkbook.Create;
  try
    // True by default; set it explicitly so the intent survives refactoring.
    // It has to be in place before Open, because Open builds the state
    Workbook.PreserveUnsupportedParts := True;
    Workbook.Open('quarterly-review.xlsx');

    Chart := Workbook.Sheets[1].Charts[0];   // Sheets[] is 1-based, Charts[] 0-based
    if not Chart.HasPreservedXml then
      Log('chart 0 has no original ChartML attached');   // Log is your own routine

    Chart.Title := Chart.Title;                  // equal value: still replays
    Workbook.Sheets[1].Charts[1].Title :=
      'Revenue by region, Q3 2026';              // this chart takes the merge path
    Workbook.SaveAs('quarterly-review-out.xlsx');
  finally
    Workbook.Free;
  end;
end;
What survives a merge when you edit one chart?
The short answer: everything the typed model does not own. Title, series, data caches, plot groups and axes belong to the model, so the newly generated tree decides them. Unmodelled attributes, namespace declarations, styles, extension lists and formatting nodes come from the original tree and are reinserted beside the matched nodes they used to sit next to
Delete a series and the merge must not resurrect it from the preserved XML merely because the original still contains a c:ser at that position. Anything the model owns is taken from the model, even when the model's answer is "gone". The same applies at attribute level: when you clear bold, italic, underline, strike-through or the font size of a known text style, the merge reads the missing attribute as a clear and does not copy b or sz back from the original defRPr. Unknown attributes on the same element keep their place
Titles follow the same rule. On import, HotXLS keeps the native rich runs of c:title, with their per-run fonts, sizes and language tags, and replays them for as long as the text is untouched. Assign a new Title and that rich content is dropped; the title is rewritten as a single run styled from TitleTextStyle. Merging old runs into new text would mean guessing which run the new words belong to, and a guess here produces titles nobody ever typed
Schema order is preserved wherever Office is fussy about it. An extLst stays the last child of its parent, as the schema requires. Markup-compatibility blocks get their own treatment: the reader skips mc:Choice and reads mc:Fallback, and when that fallback wraps a plot group the model knows, the merge writes the new typed content back into the fallback subtree. A naive merge would emit the edited plot group and leave the old copy inside the fallback branch, so the saved chart would carry the same group twice
Opting one chart out with ClearPreservedXml
TXLSXChart.ClearPreservedXml drops the original XML and fingerprint for one chart, and the next save rebuilds that chart purely from the typed model. It is a per-chart decision. PreserveUnsupportedParts still governs whether preservation state is built at import, and it also covers other unsupported package parts, not just charts, which is why switching it off to get one clean chart is the wrong lever to pull
Clear a chart when discarding is the whole point of the operation, for example a template chart that still carries formatting from a retired corporate theme. Do not reach for it as a debugging reflex. A chart that renders wrongly after an edit is usually a modelling question, and clearing the preserved XML throws away the only copy of what Excel originally wrote
One case needs checking first. If an error bar or trendline uses line formatting the typed model cannot represent, its LineAppearanceSupported property is False; a trendline label with formatting outside the model reports the same through LabelAppearanceSupported. HotXLS will not quietly swap either for a plainer version: once the chart has no preserved XML to fall back on, the save stops with an EArgumentException naming the unrepresented line or label appearance. Testing for both before you clear takes a single loop
// Your own helper, not part of HotXLS: True when every error bar line,
// trendline line and trendline label can be written from the typed model alone
function ChartRebuildable(Chart: TXLSXChart): Boolean;
var
  I, T: Integer;
  S: TXLSXChartSeries;
begin
  Result := False;
  for I := 0 to Chart.SeriesCount - 1 do    // spans every plot group
  begin
    S := Chart.Series[I];
    if (S.ErrBarX <> nil) and not S.ErrBarX.LineAppearanceSupported then Exit;
    if (S.ErrBarY <> nil) and not S.ErrBarY.LineAppearanceSupported then Exit;
    for T := 0 to S.TrendlineCount - 1 do
    begin
      if not S.Trendlines[T].LineAppearanceSupported then Exit;
      if not S.Trendlines[T].LabelAppearanceSupported then Exit;
    end;
  end;
  Result := True;
end;

// ...
Chart := Workbook.Sheets[1].Charts.FindByName('Old theme chart');
if (Chart <> nil) and ChartRebuildable(Chart) then
  Chart.ClearPreservedXml      // next save rebuilds this chart from the model
else
  Log('kept original ChartML for this chart');
Combination charts with AddPlotGroup and a secondary axis
TXLSXChart.AddPlotGroup appends an ordered plot group with its own chart family and its own primary or secondary axis assignment. That covers the chart every finance team asks for sooner or later: revenue as columns on the left axis, margin percentage as a line on the right. Each chart exposes ValueAxis, CategoryAxis, SecondaryValueAxis, SecondaryCategoryAxis and SeriesAxis, with typed settings for position, axis identifiers, crossing, date units, label intervals, number format and visibility
The flat API from single-type charts is still there and maps onto the groups. ChartType and AddSeries address the first plot group; SeriesCount and Series[] walk the series of every group in order, which is why the helper above sees the line series too. Order matters in one place. TXLSXCharts.Add creates a chart with no plot group at all, and whichever of AddSeries or AddPlotGroup runs first creates group one. Call AddPlotGroup(xlsxChartLine, xlsxAxisSecondary) first on a fresh chart and the line becomes group one, the chart type switches to line, and the revenue series you add next lands in it. Creating both groups explicitly removes the ambiguity, which is what the example does
var
  Chart: TXLSXChart;
  Columns, Line: TXLSXChartPlotGroup;
begin
  // Anchored over rows 1..15, columns 5..12; no plot group exists yet
  Chart := Sheet.Charts.Add(xlsxChartColumn, 'Revenue and margin',
    1, 5, 15, 12);
  Columns := Chart.AddPlotGroup(xlsxChartColumn);              // group 1, primary
  Columns.AddSeries('Revenue', 'Data!$A$2:$A$13', 'Data!$B$2:$B$13');

  Line := Chart.AddPlotGroup(xlsxChartLine, xlsxAxisSecondary); // group 2
  Line.AddSeries('Margin %', 'Data!$A$2:$A$13', 'Data!$C$2:$C$13');
  Line.ZOrder := 1;                     // draw the line in front of the columns

  Chart.SecondaryValueAxis.NumberFormat := '0%';
  Chart.SecondaryValueAxis.NumberFormatSourceLinked := False;
  Chart.SecondaryValueAxis.MinValue := 0;
  Chart.SecondaryValueAxis.MaxValue := 0.5;

  // Plot area as fractions of the chart: x, y, width, height in one call
  Chart.PlotAreaLayout.SetPositionAndSize(0.08, 0.12, 0.80, 0.72);
end;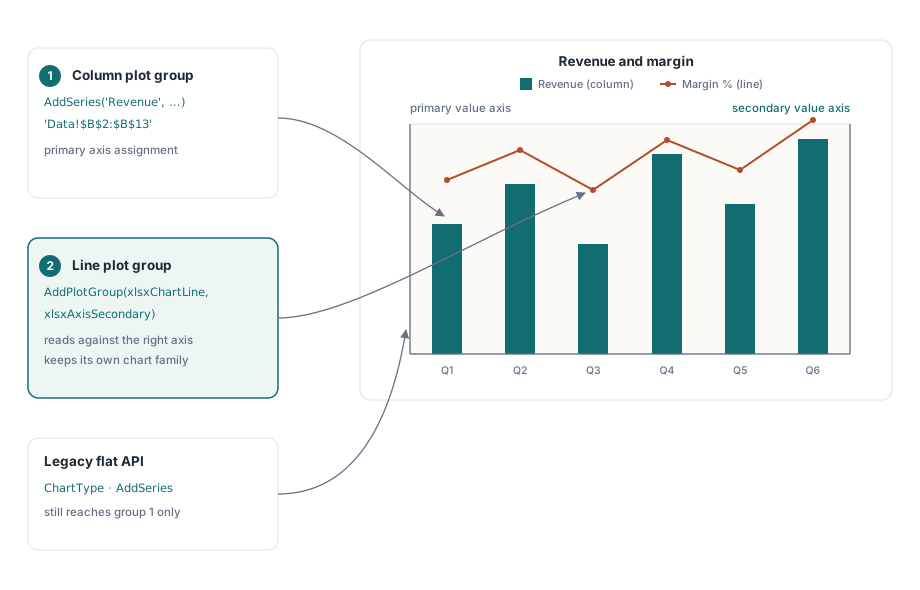
ZOrder on a plot group controls layering: the chart writer sorts groups by it before emitting the c:barChart and c:lineChart blocks, lower values behind. Because every ordered group is modelled, opening and resaving a combination chart keeps each chart family together with its secondary, date and series axes. Chart formula references and cached series values survive workbook copies and open/save cycles, and chart anchors are matched to their chart parts by relationship identifier, so a package whose relationship entries were reordered by another tool still puts each chart at its own worksheet position
Why does Office ignore a manual layout?
Because the coordinates arrived incomplete. Office requires x, y, w and h as a complete group whenever any one of them is present in a c:manualLayout, and ignores the entire element otherwise. The schema marks all four as optional, so a file with only x and y is valid and still does nothing in Excel
TXLSXChartLayout.SetPositionAndSize is the call to use. It sets all four values, marks the four mode elements as present and enables the layout in a single step. The individual X, Y, Width and Height properties each set one value, and HotXLS writes exactly the elements that are present, in the same way that it keeps the presence of each of the nine optional children when it reads a file. That keeps an untouched layout faithful to its source. It also means a layout built from two property assignments is written with two coordinates, and Office will skip it. The same TXLSXChartLayout class sits behind PlotAreaLayout, TitleLayout, LegendLayout and each axis's TitleLayout
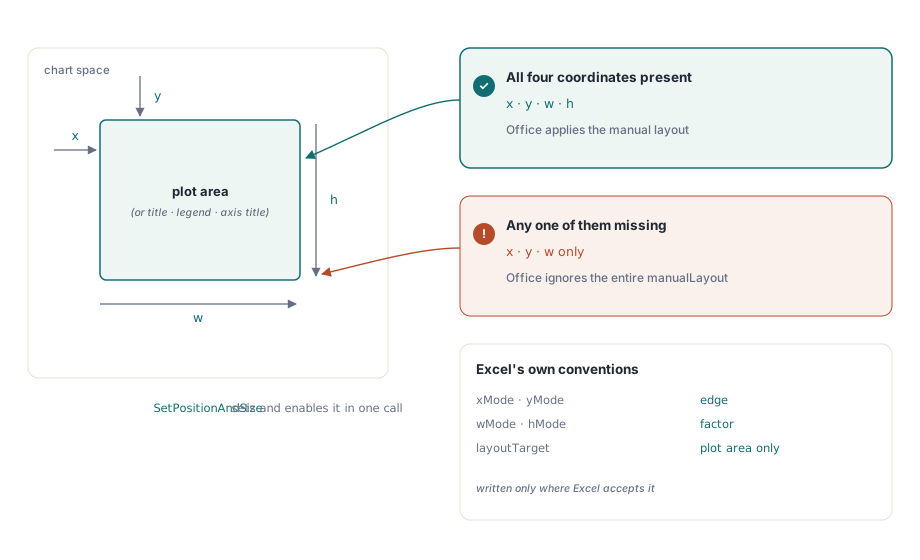
Two defaults follow what Excel does rather than everything the specification allows. A new layout uses edge for XMode and YMode and factor for WidthMode and HeightMode; the standard permits the other combinations, but Excel saves positions as edges and sizes as factors and converts anything else when it saves. And layoutTarget (Target, inner or outer) is written for the plot area, whereas title, axis title and legend layouts omit it, because Microsoft's implementation notes for the chart schema do not allow it under those elements
Fitting this into a workbook round trip
Chart preservation is one instance of a broader rule: a library that edits documents authored elsewhere should change what it was asked to change and leave the rest as it found it. HotXLS applies the same reasoning to themes, calculation chains and worksheet extensions, covered in lossless round trips for theme, extLst and calcChain, and to VBA projects and external links in preserving VBA and external links. For creating charts, placing images and drawing shapes from scratch, see charts, images and drawings in HotXLS
HotXLS reads, edits and writes XLSX charts from native Delphi and C++Builder code without Excel installed on the machine, so chart fidelity is decided by the library rather than by an automation server. The chart API reference and a trial build are on the HotXLS Delphi spreadsheet component page