HotXLS can place a chart directly on a worksheet, anchored to a cell range, instead of putting it on a dedicated chart sheet. In BIFF8 terms that means writing a drawing shape with an OBJ record of type 5 and parking the chart substream at the end of the sheet record stream, which is exactly the layout Excel produces and exactly where the reader expects to find it
The distinction matters to anyone generating operational reports. A chart sheet is a fine home for a single headline visual. A monthly regional breakdown wants the chart next to the numbers it summarises, on the same sheet, sized to the block of cells it belongs to, so a reader scrolls once instead of switching tabs and losing context
Reading was already there, writing was not
The asymmetry is worth naming because it shapes the work. HotXLS could already read embedded charts: when the worksheet record stream contains a BOF marked as a chart substream, the parser switches context, collects the chart records, and on the closing EOF hands them back to the drawing shape that the OBJ record introduced. That path had been exercised by every Excel-authored workbook the library ever opened
What was missing was the authoring side, and the useful consequence is that the new writer had a precise specification to hit: produce the byte layout the existing reader already reattaches. There is no better acceptance criterion for a binary format feature than an independently written reader you did not get to change
What an embedded chart is made of
Three pieces have to agree. The drawing layer contributes a host-control shape, the object layer contributes an OBJ record whose common object data declares object type 5, and the record stream contributes the chart substream itself. The option flags on the OBJ record are the ones Excel writes for a chart frame: positioned, locked, automatic line and automatic fill, which is what makes the embedded chart behave like a native one when a user clicks it
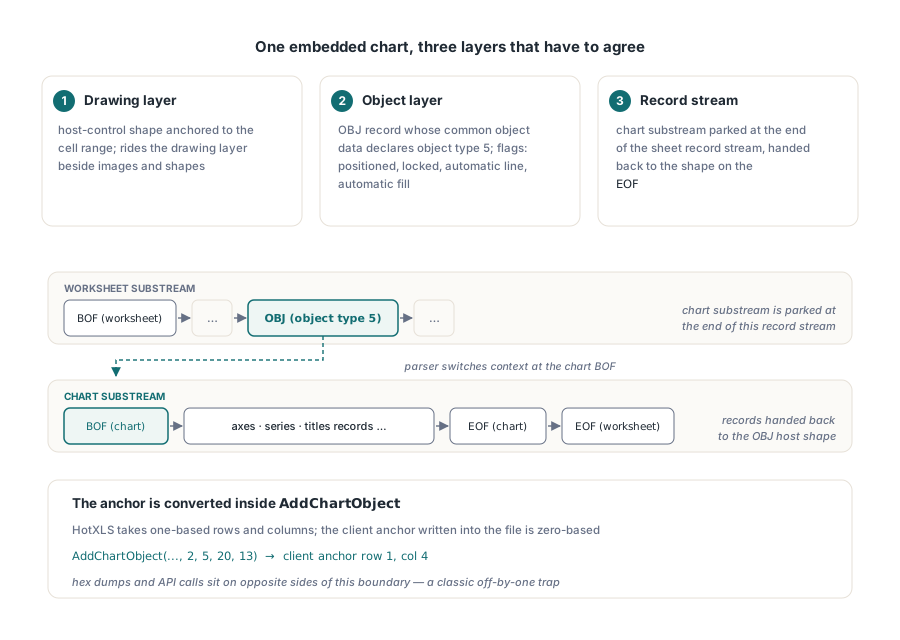
The anchor deserves a note because it is a common source of off-by-one bugs. The HotXLS API takes one-based row and column numbers, matching the rest of the library, and the client anchor written into the file is zero-based. The conversion happens inside AddChartObject, so callers stay in the coordinate system they use everywhere else, but anyone comparing a hex dump against their own call needs to remember which side of that boundary they are reading
var
  Book: TXLSWorkbook;
  Sheet: TXLSWorksheet;
  Series: array[0..1] of TXLSChartSeriesInfo;
begin
  Book := TXLSWorkbook.Create;
  try
    Book.Open('regional-sales.xls');
    Sheet := Book.Sheets[0];

    FillChar(Series, SizeOf(Series), 0);
    Series[0].Name := 'Actual';
    Series[0].Categories := 'Data!$A$2:$A$13';
    Series[0].Values := 'Data!$B$2:$B$13';
    Series[0].DataLabels.ShowValue := True;
    Series[0].HasDataLabels := True;

    Series[1].Name := 'Target';
    Series[1].Categories := 'Data!$A$2:$A$13';
    Series[1].Values := 'Data!$C$2:$C$13';
    Series[1].SecondaryAxis := True;

    // Anchored to E2:M20 on this sheet, one-based
    Sheet.AddChartObject(xlsChartTypeColumn, 'Regional sales',
      'Month', 'Amount', Series, 2, 5, 20, 13);

    Book.SaveAs('regional-sales-charted.xls');
  finally
    Book.Free;
  end;
end;
The FillChar on the series array is not decoration. TXLSChartSeriesInfo carries several optional sub-records, data labels, per-series style, trendlines and error bars, each gated by a boolean, and a partially initialised record on the stack will hand the emitter flags nobody set. Zero the array, then set the fields you mean
Which series references does the embedded path accept?
Plain A1-style ranges inside the same workbook, and that restriction is deliberate rather than an oversight. Every reference is resolved against the workbook sheet list and turned into the external reference index the chart records need. A named range or an external workbook reference falls back to a placeholder with a zero-length parsed expression, so the chart writes cleanly but that particular series has no data source until you point it at a range
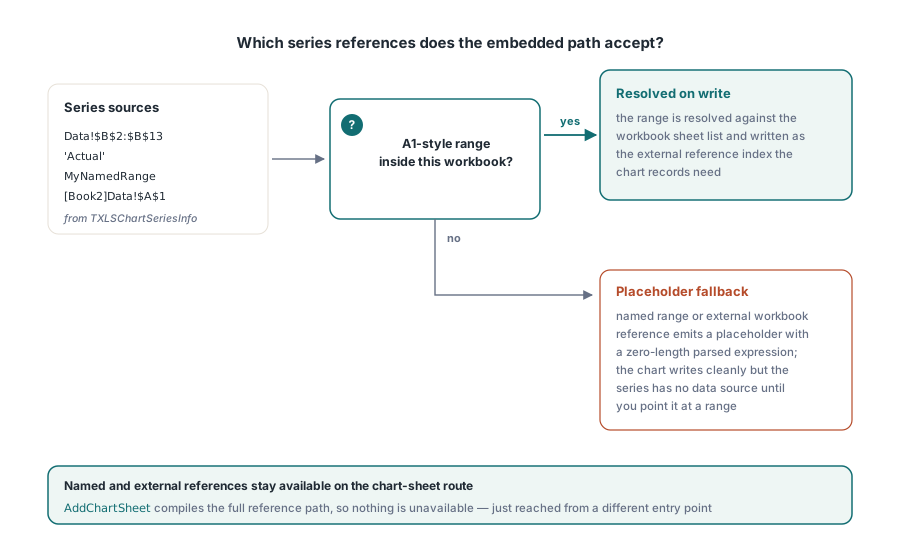
The reason is a straight engineering trade. The full reference compilation path exists on the chart-sheet route, wrapped inside the worksheet-collection layer, and lifting it out cleanly would mean duplicating a hundred lines of resolution logic for a case that is uncommon in practice. An embedded chart is nearly always plotting cells on its own sheet or a sibling data sheet. Named and external references are covered on the chart-sheet path via AddChartSheet, so nothing is unavailable, just reached from a different entry point
Everything else in the series model works identically on both routes. Secondary axis binding, per-series line, fill and marker styles, trendlines, error bars and data labels are all part of TXLSChartSeriesInfo and all emitted the same way, so a chart definition can move between an embedded object and a chart sheet with only the call changing. The axis-group mechanics behind the secondary axis flag are covered in secondary axis groups on BIFF write
Why did the chart title read as two characters?
Because a character count was passed where a byte count was expected, and BIFF Unicode strings make that mistake easy to write and hard to see. A short BIFF Unicode string begins with a character count and a flags byte, and the flags byte carries the high-byte bit that says whether the payload is one byte per character or two. Read a 16-bit payload with the character count as if it were a byte length and you get exactly half the string: a series named Sales comes back as Sa, and a chart title truncates the same way because titles and series labels share the decoding path
What makes this defect notable is that it recurred three times in the same family of records, once in trendline names, once in pivot chart names, and once in chart titles. Each occurrence looked like a fresh bug in a new feature. All three were the same missing multiply. The rule that finally closed it out is mechanical and should be applied without judgment: whenever you read one of these strings, consult the high-byte flag first and multiply the character count by the payload width before touching the buffer. The record-level details are in decoding XLUnicodeString character counts and the high-byte flag
// The embedded chart shares the drawing layer with images and shapes,
// so an existing drawing on the sheet is preserved. AddChartObject
// returns the index of the created object
var
  ObjIndex: Integer;
begin
  ObjIndex := Sheet.AddChartObject(xlsChartTypeLine, 'Trend',
    'Week', 'Units', Series, 2, 8, 18, 16);
  if ObjIndex < 0 then
    raise Exception.Create('chart object was not created');
end;
Where embedded charts fit against the alternatives
Three routes exist and they answer different questions. An embedded chart object belongs next to its data on a worksheet and is what most reports want. A chart sheet suits a single presentation visual and gives you the full reference compilation path. Preserving an existing chart from a loaded file, untouched, is the right answer when the workbook came from Excel with formatting nobody wants a library to reinterpret; that pass-through behaviour is described in preserved ChartML and combination charts
Because the embedded chart rides the drawing layer, it coexists with images and shapes on the same sheet rather than replacing them, and the general model for that layer is covered in charts, images and drawings in HotXLS. All three routes ship in the HotXLS Delphi spreadsheet component, so the choice is about what the report should look like rather than about what the library can express
The methodological point is the one worth keeping. When a binary format feature has an existing reader, build the writer against the reader rather than against your reading of the specification. The reader encodes years of contact with files real applications actually produced, including the parts the specification states loosely, and a writer that satisfies it is far more likely to satisfy Excel too