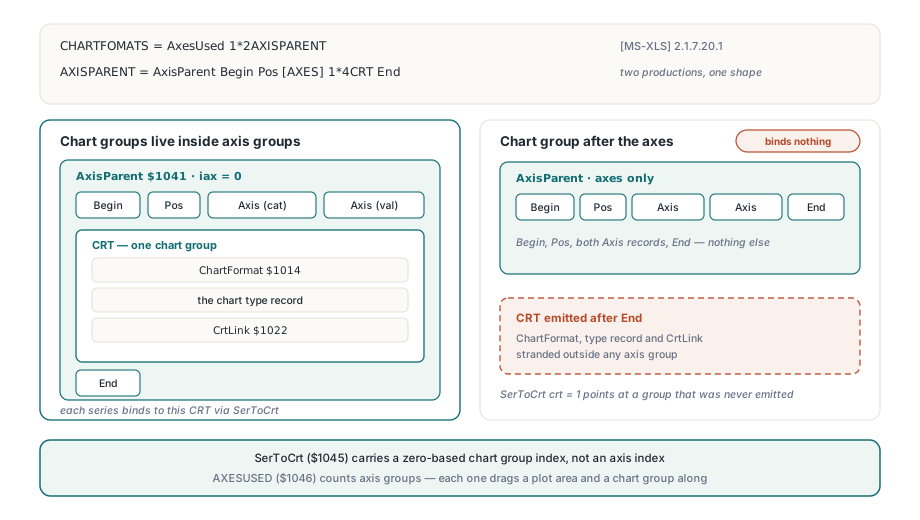
HotXLS writes BIFF8 chart secondary axis groups by emitting a second AxisParent block, not by appending a second chart group after the axes. In the Classic XLS chart substream every chart group — ChartFormat, the chart type record, CrtLink — lives inside its own axis-group block, and each series binds to one through SerToCrt. Get that nesting backwards and there is no second chart group for a series to bind to, however many axis records you emit
Why does a second chart group after the axes bind nothing?
The grammar is the whole answer, and it is one line of ABNF. The CHARTFOMATS rule in [MS-XLS] 2.1.7.20.1 says AxesUsed 1*2AXISPARENT, and then spells out AXISPARENT = AxisParent Begin Pos [AXES] 1*4CRT End. Read those two productions together and the shape falls out: the chart groups are children of an axis group, not siblings of it. A chart substream with two axis pairs and one trailing chart group is not a dual-axis chart with a layout quirk; it is a chart with one chart group and a set of orphan axis records. That matters because SerToCrt ($1045), which sits inside the SERIESFORMAT block, carries a zero-based chart group index, not an axis index. Writing crt = 1 when only one CRT block exists points a series at a chart group that was never emitted. The intuition that trips people up is the record name: AXESUSED ($1046) sounds like it counts axes, so the natural next move is to emit more axes. It counts axis groups, and every axis group drags a complete plot area and chart group along with it
Marking a series for the secondary axis group
On the HotXLS side this collapses to one Boolean. TXLSChartSeriesInfo carries a SecondaryAxis field, and setting it on any series in the array you hand to TXLSWorksheets.AddChartSheet switches the whole builder into two-group mode. There is no separate "enable secondary axis" call and no axis-count parameter, because the count is derivable: if any series wants the secondary group, the chart needs two
var
  Wb: TXLSWorkbook;
  Series: array [0..1] of TXLSChartSeriesInfo;
begin
  Wb := TXLSWorkbook.Create;
  try
    Wb.Sheets.Add.Name := 'Data';
    // ... fill A1:C12 with categories, revenue and margin ...

    Series[0] := Default(TXLSChartSeriesInfo);   // never FillChar this record
    Series[0].Name := 'Revenue';
    Series[0].Categories := 'Data!$A$1:$A$12';
    Series[0].Values := 'Data!$B$1:$B$12';

    Series[1] := Default(TXLSChartSeriesInfo);
    Series[1].Name := 'Margin';
    Series[1].Categories := 'Data!$A$1:$A$12';
    Series[1].Values := 'Data!$C$1:$C$12';
    Series[1].SecondaryAxis := True;             // AXESUSED becomes 2

    Wb.Sheets.AddChartSheet('Dual Axis', xlsChartTypeLine,
      'Revenue vs Margin', '', '', Series);
    Wb.SaveAs('dual-axis.xls', xlExcel97);
  finally
    Wb.Free;
  end;
end;
The Default(TXLSChartSeriesInfo) line is not decoration. TXLSChartSeriesInfo mixes managed fields (the WideString names, the dynamic trendline and error-bar arrays) with plain Boolean members, and Delphi only guarantees the managed fields are cleared for you. Leave SecondaryAxis uninitialised and it is whatever was on the stack, which in practice means the same binary produces a single-axis chart when run from a console host and a dual-axis chart under the test runner. The category and value ranges, meanwhile, resolve through the workbook's EXTERNSHEET table before the builder ever sees them — the same index machinery covered in how HotXLS classifies BIFF SupBook and XTI external links — so a range naming an unknown sheet degrades to an empty placeholder BRAI rather than failing the build
What HotXLS emits when a series is secondary
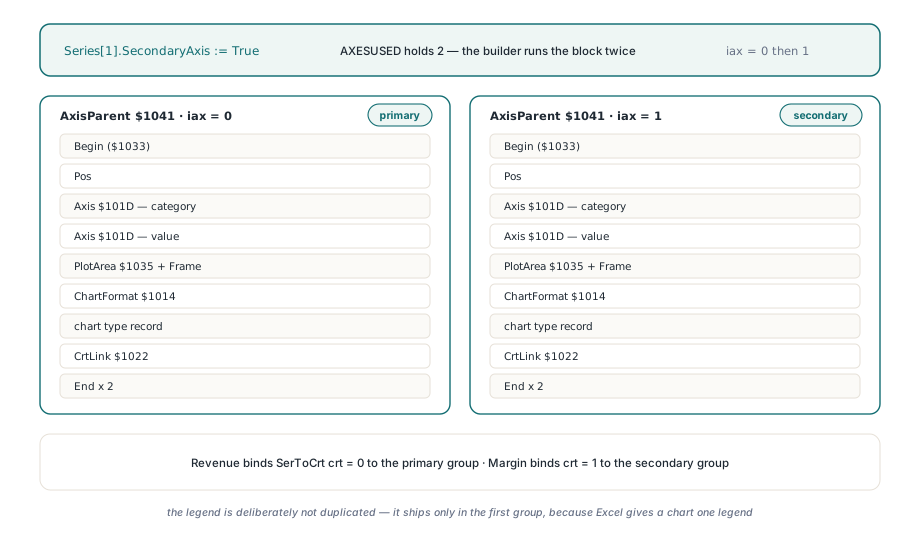
The emitter changes shape, not just a value. With no secondary series, AXESUSED holds 1 (or 0 for pie and 3D pie, which have no axis groups at all) and one AxisParent block follows. With one, AXESUSED holds 2 and the builder runs the block twice, with iax — the first word of the 18-byte AxisParent ($1041) payload — set to 0 and then 1. Each pass emits Pos, the category axis and the value axis (Axis, $101D), the PlotArea marker ($1035), a default Frame, then ChartFormat ($1014), the chart type record, CrtLink ($1022), and two End markers to close the chart group and the axis group. The secondary series then binds with SerToCrt crt = 1, and the primary one keeps crt = 0. One record deliberately does not get duplicated: the legend is emitted only in the first group, because Excel gives a chart one legend regardless of how many axis groups it carries. Two other properties are worth stating plainly. Restructuring the emitter to put the chart group inside the axis-parent block did not change the output for ordinary charts — with no secondary series the substream is byte-identical to the previous version, since parameterising AddAxisParent with iax = 0 is exactly the old code path. And the builder still emits a full axis pair per group, so a secondary group always arrives with its own category axis even when you only care about its value scale
How does chart inspection recover the axis-group binding?
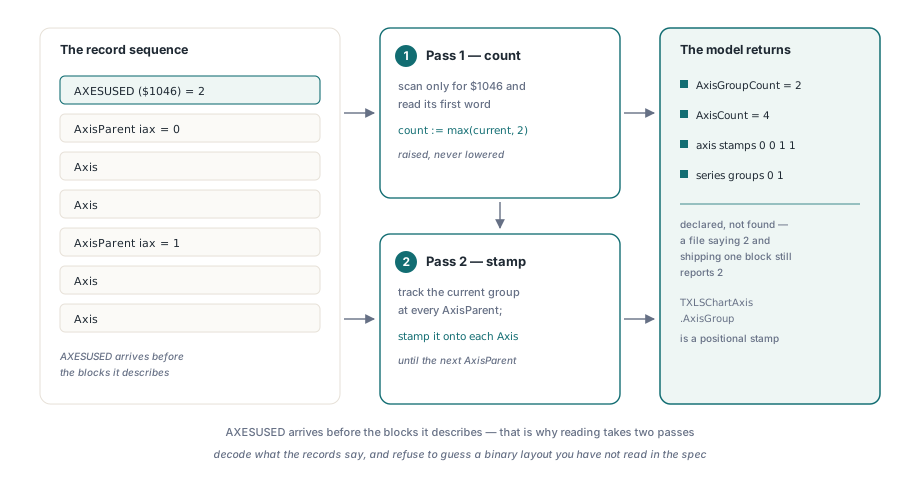
Reading is two passes over the record list, and it has to be, because AXESUSED arrives before the blocks it describes. The first pass looks only for $1046 and reads its first word as the axis-group count. That value starts at 1 and is raised, never lowered: HotXLS takes the maximum of the current count and the declared one, so a malformed or duplicated AXESUSED cannot regress a chart that has already been seen to declare two groups. The second pass tracks the current axis group, updating it at every AxisParent, and stamps that index onto every Axis record it meets until the next AxisParent appears
var
  Model: TXLSChartModel;
  i: Integer;
begin
  // Sheets[1] is the data worksheet, Sheets[2] the chart sheet
  Model := Wb.Sheets[2]._Chart.GetChartModel;
  try
    if Model.AxisGroupCount = 2 then
      Writeln('AXESUSED declares a secondary axis group');
    for i := 0 to Model.AxisCount - 1 do
      Writeln('axis ', i, ' group ', Model.GetAxis(i).AxisGroup);
    for i := 0 to Model.SeriesCount - 1 do
      Writeln('series ', i, ' chart group ', Model.GetSeries(i).ChartGroup);
  finally
    Model.Free;
  end;
end;
Two limits are worth naming. TXLSChartModel.AxisGroupCount reports what the file declares, not how many AxisParent blocks were actually found; a file that says 2 and ships one block will report 2, and AxisCount is where you notice. And TXLSChartAxis.AxisGroup is a positional stamp: it records which block an axis was read inside, which is the only thing the format tells you. On the series side, SerToCrt decoding is gated on being inside a Series block, because the same record id appears in contexts where it is not a series binding, and an ungated decoder would happily overwrite the wrong series
Verifying secondary axes without a real Excel file
The verification here needed no Excel file with a secondary axis, and that is the useful part of the story. Structural decoding is a property of the record sequence, so a synthesised sequence proves it exactly as well as a captured one. The regression builds AXESUSED with a payload of 2, then two AxisParent blocks each wrapping a category axis and a value axis, and asserts the model comes back with AxisGroupCount = 2, four axes stamped 0, 0, 1, 1, and the expected axis types on the second pair
// Structural verification with no Excel file involved at all
Chart := TXLSCustomChart.Create(nil, $0600);
try
  AddWordRecord($1046, [2]);   // AXESUSED: two axis groups
  AddAxisParentGroup(0);       // AxisParent iax=0 + Begin + 2 Axis + End
  AddAxisParentGroup(1);       // AxisParent iax=1 + Begin + 2 Axis + End

  Model := Chart.GetChartModel;
  Assert.AreEqual(2, Model.AxisGroupCount);
  Assert.AreEqual(4, Model.AxisCount);
  Assert.AreEqual(0, Model.GetAxis(1).AxisGroup);
  Assert.AreEqual(1, Model.GetAxis(2).AxisGroup);
finally
  Model.Free;
  Chart.Free;
end;
Two practical notes if you synthesise records yourself. TXLSCustomChart.AddData(RecID, Len, nil) dereferences the payload when Len is non-zero, so Begin ($1033) and End ($1034) markers must be added with a length of zero, not with a nil blob and a stale length. And a synthetic sequence proves the decoder, never Excel's acceptance of your output — the write side was structured from the ABNF and then checked by round-tripping through GetChartModel, asserting per-axis stamps 0/0/1/1 and per-series chart groups 0/1, with the byte-identical no-secondary path as the safety net. That is the same conservative posture the rest of the HotXLS chart, image and drawing support for Delphi is built on: decode what the records say, and refuse to guess a binary layout you have not read in the spec. The full Delphi suite ran 1650 of 1650 on Win32 and Win64 after the write side landed
Chart3d scene parameters and the fAuto trap
Two adjacent details bite people who go past the default chart. The first is Chart3d ($103A, [MS-XLS] 2.4.46), a flat 14-byte payload emitted inside the chart group for 3D variants: anRot (rotation, 0 to 360), anElev (elevation, signed, -90 to 90), pcDist (perspective distance, 0 to 100, ignored unless fPerspective is set), pcHeight and pcDepth (percent of chart width, 5 to 500), pcGap (0 to 500), and a grbit whose bits are fPerspective $0001, fCluster $0002, fAutoscale $0004, f3DScaling $0010 and f2DWalls $0020. The spec adds constraints the record layout will not enforce for you: on a transposed bar chart anRot and anElev must not exceed 44, and on a pie chart anElev must not be negative
The second is the fAuto bit, and it is the one that produces the "my colours were ignored" bug report. LineFormat ($1007), AreaFormat ($100A) and MarkerFormat ($1009) all carry fAuto in bit 0 of their grbit, and when that bit is set Excel applies its automatic style and treats the explicit RGB values, line style, marker shape and marker size sitting right next to it as decoration. Any emitter writing a custom series style must clear bit 0; the default emitters keep it set precisely so Excel picks the palette. If you are editing an existing workbook rather than building one, the preservation rules differ again and are covered in editing Excel charts without losing preserved ChartML
Secondary axis groups, SerToCrt binding and the typed chart model shown here ship in the HotXLS Delphi spreadsheet component for Delphi and C++Builder, which reads and writes BIFF8 charts without Excel installed; the product page carries the full chart record reference and the AddChartSheet overload list