HotXLS builds and refreshes native XLSX pivot tables from Delphi and C++Builder with no Excel install and no COM automation on the machine. You call AddPivotTable with a source range, drop fields onto the row, column, page, and data axes, layer on calculated items or a percent-of-total display, and the component writes the pivotCacheDefinition and pivotTableDefinition parts that Excel opens as a live, refreshable pivot
The scenario that makes this worth the trouble is a reporting server. You generate hundreds of workbooks a night, each carrying a pivot that summarises one account, and next month the numbers move and every file has to reflect the new source rows. Driving Excel from a Windows service is fragile and unlicensed for server use, and hand-writing the pivot XML is a spec-archaeology project that never ends. HotXLS sits between those two dead ends: a typed object model over the OOXML pivot parts, so the same Pascal that fills the cells also declares the pivot and rebuilds its cache in the same process
How do you create a pivot table in Delphi without Excel?
You create one with a single call and then place fields on axes. AddPivotTable takes the source range in A1 notation, the destination cell where the table anchors, and a name; it parses the range, scans every column to infer its data type, builds a pivot cache (or reuses one already bound to the same range), and returns a TXLSPivotTable whose fields all start off-axis. From there the convenience methods AddRowField, AddColumnField, AddPageField, and AddDataFieldByName wire the layout, and each data field takes one of eleven aggregations from the TXLSPivotAggregation enum (xlpaSum, xlpaCount, xlpaAverage, xlpaMax, xlpaMin, xlpaProduct, xlpaCountNums, xlpaStdDev, xlpaStdDevP, xlpaVar, xlpaVarP)
uses
  lxHandleX, lxPivot;

var
  Book : TXLSXWorkbook;
  Sheet: TXLSXWorksheet;
  Pivot: TXLSPivotTable;
begin
  Book := TXLSXWorkbook.Create;
  try
    Book.Open('sales.xlsx');
    Sheet := Book.Sheets[1];                 // report sheet (1-based in the XLSX engine)

    // Source A1:E500 on the 'Data' sheet; anchor the pivot at row 3, col 1.
    Pivot := Sheet.AddPivotTable('Data!$A$1:$E$500', 3, 1, 'SalesByRegion');
    if Pivot <> nil then
    begin
      Pivot.AddRowField('Region');
      Pivot.AddColumnField('Quarter');
      Pivot.AddPageField('Year');
      Pivot.AddDataFieldByName('Revenue', xlpaSum);
      Pivot.AddDataFieldByName('Units', xlpaAverage);
      Book.SaveAs('sales-pivot.xlsx');
    end;
  finally
    Book.Free;
  end;
end;
Why the cache and the table are two separate parts
A pivot table is really two artifacts that reference each other, and understanding the split is what keeps the rest of this straight. The pivotCacheDefinition is the data snapshot: a worksheetSource pointing at the source range, and one cacheField per column holding that column's distinct values (its sharedItems) plus derived bounds. The pivotTableDefinition is the view: which cache field sits on which axis, the data fields and their aggregations, the layout toggles. The view binds to the cache by cacheId through the workbook's pivotCaches relationship, exactly as ECMA-376 Part 1 §18.10 and [MS-XLSX] lay it out
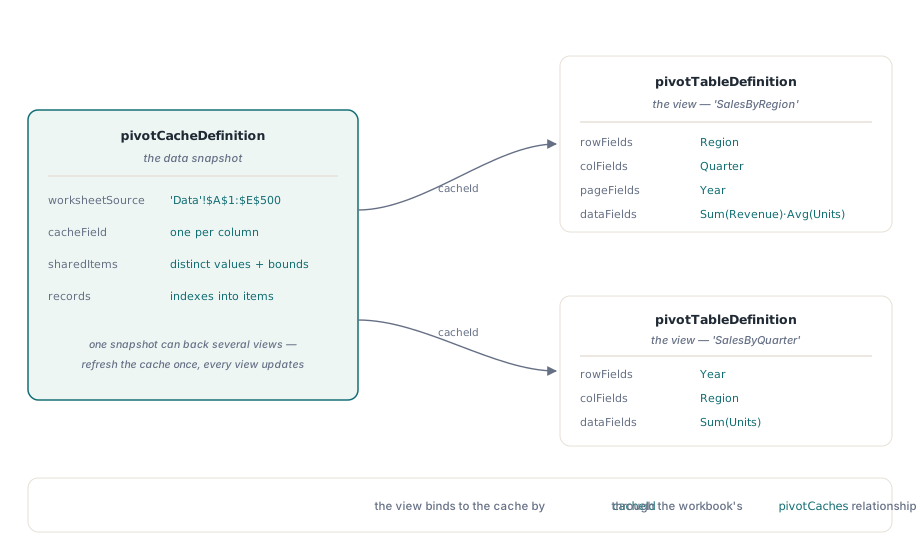
That indirection is not bureaucracy, it buys two things. One cache can back several tables, so refreshing the cache once updates every view drawn from it. And the cache stores each column's values deduplicated with a per-record index table rather than the raw grid, which is why building a pivot means scanning the source, not copying cells. HotXLS models this the same way for both engines, so the code above is nearly identical to the classic path documented alongside the binary SX-record layout behind classic .xls pivots. If your source lives on another sheet or you address it through a name, the range prefix and defined names and cross-sheet references follow the usual A1 rules, with quoted sheet names allowed for names that contain spaces
Calculated items are not calculated fields
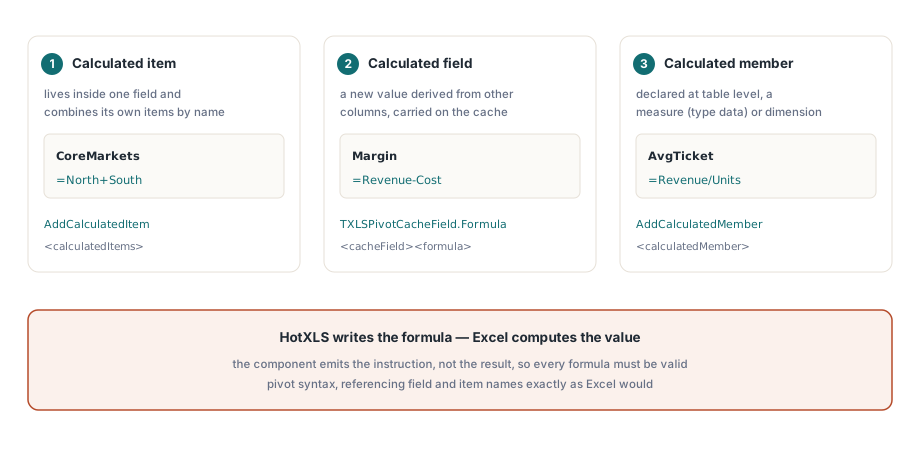
These three terms name three different things, and mixing them up is the classic pivot mistake. A calculated item lives inside one field and combines that field's own items by name, so within a Region field you can define a synthetic CoreMarkets row equal to North plus South; HotXLS exposes it as TXLSPivotField.AddCalculatedItem and writes a <calculatedItem> under that field's <calculatedItems>. A calculated field is different: it is a new value derived from other columns, like Margin from Revenue and Cost, and it is carried as a formula on a cache field through TXLSPivotCacheField.Formula. A calculated member, added with TXLSPivotTable.AddCalculatedMember, is a table-level custom member that can act as a measure (member type data) or a dimension member, mainly of interest for OLAP-shaped pivots
var
  Region: TXLSPivotField;
  Member: TXLSPivotCalculatedMember;
begin
  // A calculated ITEM combines items of a single field by name.
  Region := Pivot.AddRowField('Region');
  Region.AddCalculatedItem('CoreMarkets', '=North+South');

  // A calculated MEMBER is declared at the table level. Member type
  // 'data' marks it as a measure; an empty type is a dimension member.
  Member := Pivot.AddCalculatedMember('AvgTicket', '=Revenue/Units');
  Member.MemberType := 'data';
end;
One honest boundary applies to all three. HotXLS emits the formula text into the definition XML; it does not evaluate it. Excel computes the calculated item, field, or member when it opens the file, the same way it computes every aggregate in the grid. HotXLS is writing the instructions, not the results, so the formulas you supply have to be valid pivot formulas in Excel's own dialect, referencing field and item names as Excel would
How do you show values as a percent of total?
You set the value display mode on the data field rather than transforming the numbers yourself. TXLSPivotDataField.ShowDataAs takes the TXLSPivotShowDataAs enum, which mirrors the OOXML ST_ShowDataAs values: xlpsdaNormal, xlpsdaDifference, xlpsdaPercent, xlpsdaPercentDiff, xlpsdaRunTotal, xlpsdaPercentOfRow, xlpsdaPercentOfCol, xlpsdaPercentOfTotal, and xlpsdaIndex. A common trick is to place the same source column on the data axis twice, once as a raw sum and once as a share of the grand total, so the report shows both the number and its weight
var
  Rev, Share: TXLSPivotDataField;
begin
  Rev := Pivot.AddDataFieldByName('Revenue', xlpaSum);

  Share := Pivot.AddDataFieldByName('Revenue', xlpaSum);
  Share.DisplayName := 'Share of total';
  Share.ShowDataAs  := xlpsdaPercentOfTotal;

  // Item-relative modes need a base to compare against. A running total
  // down 'Quarter' (cache-field index 3) would read:
  //   Share.ShowDataAs := xlpsdaRunTotal;
  //   Share.BaseField  := 3;         // cache-field index the transform runs over
  //   Share.BaseItem   := $7FFD;     // $7FFD = "(All)"
end;
xlpsdaPercentOfTotal needs no base because it is relative to the grand total, but the item-relative modes do. xlpsdaDifference, xlpsdaPercentDiff, and xlpsdaRunTotal require BaseField (the cache-field index the comparison runs over) and, for the item-anchored forms, a BaseItem index, where $7FFD stands for the (All) sentinel. HotXLS writes these as the <dataField showDataAs="percentOfTotal" baseField="N" baseItem="M"/> attributes and, as with calculated formulas, leaves the arithmetic to Excel
Grouping dates and numbers, and page-field filters
Grouping is configured on the cache field, not the pivot field, because it changes how the source domain is bucketed. Set HasGroup := True on the cache field returned by Cache.FindFieldByName, then pick either the numeric-range knobs (GroupStartNum, GroupEndNum, GroupInterval) or the date-hierarchy flags (GroupByDate with GroupMonths, GroupQuarters, GroupYears, and a GroupStartDate / GroupEndDate span). HotXLS emits the matching <fieldGroup><rangePr groupBy="months"/> element so a field grouped by month or by a 1000-wide numeric band opens the way Excel would have grouped it
Page fields are the filter dropdowns above the table. AddPageField places a field on the page axis, and PageItemIndex pre-selects a single cache item, defaulting to xlPageItemAll ($7FFD, meaning (All)). To let a reader tick several items at once, set MultipleItemSelectionAllowed := True, which HotXLS writes as <pivotField multipleItemSelectionAllowed="1"/>. For criteria beyond a manual pick, every field carries a typed Filters collection spanning the OOXML ST_FilterType families — count, percent, sum, caption, value, and date filters — each entry pairing a filter type with its comparison values
How do you refresh a pivot cache when the source changes?
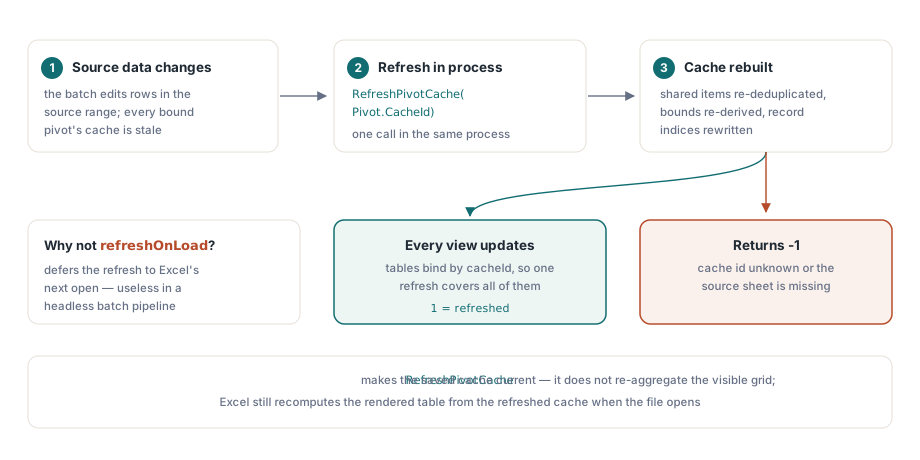
RefreshPivotCache on TXLSXWorkbook re-scans the source range and rebuilds the cache in place, which is what a batch pipeline needs after it edits the underlying rows. Pass the cache id, and the method re-reads every cell in the source range (header on the first row, data from the second), rebuilds each field's shared-item domain by re-deduplicating values and re-deriving the per-type bounds, and rewrites the per-record item indices. It returns 1 on success and -1 when the cache id is unknown or the source sheet is missing
var
  Rc: Integer;
begin
  // ...the source data has changed since the pivot was built...
  Sheet := Book.Sheets[1];
  Sheet.Cells[2, 5].Value := 128000;             // a corrected Revenue figure

  // Rebuild the cache's shared items and record indices from the source.
  Rc := Book.RefreshPivotCache(Pivot.CacheId);   // 1 = refreshed, -1 = cache/source missing
  if Rc = 1 then
    Book.SaveAs('sales-pivot-refreshed.xlsx');
end;
The semantic boundary here is worth stating plainly. Before this method existed, HotXLS relied on the refreshOnLoad="1" flag and left all refresh work to Excel on the next open, which is fine when a human will open the file but useless in a headless pipeline that has to hand off correct data. RefreshPivotCache makes the saved cache current in-process, and because tables bind to a cache by id, every pivot drawn from that cache sees the update. What it does not do is lay out or aggregate the visible grid — Excel still recomputes the rendered table from the refreshed cache when the file opens
What HotXLS writes and what Excel computes
Keep the division of labour in view and nothing surprises you. HotXLS is a definition writer: it produces the pivotCacheDefinition, the cache records, and the pivotTableDefinition, complete with axes, aggregations, calculated items and members, value displays, grouping, and filters. Excel is the calculator: on open it materialises the group buckets, evaluates the calculated formulas, applies the showDataAs transforms, and aggregates the body. The values a user sees are Excel's, produced from the instructions HotXLS wrote, which is why every formula and base index has to be correct at write time rather than checked at render time
Two limits are worth knowing before you design around this feature. AddPivotTable parses a rectangular A1 range with an optional sheet prefix; named-range and external-workbook sources are outside what the builder resolves, though caches read from an Excel-authored file preserve their named-range source on round-trip. And Excel-created pivots that HotXLS reads from disk are replayed byte-for-byte on save, so the typed edits described here apply cleanly to pivots you build in code while existing pivots stay lossless. For the input side of a report — the validated cells and filtered tables the pivot summarises — see data validation, AutoFilter, and structured tables
The pivot model shown here is part of the standard HotXLS Delphi Excel Component for Delphi and C++Builder, which reads and writes both the XLSX typed pivot parts and the classic BIFF8 records from the same object model