PDF グラフィックス: 基本パスから高度な視覚効果まで
PDF のグラフィックスは、ビットマップ画像を貼り付けるだけではありません。パス、塗り、線、色空間、座標変換、クリッピング、透明度、XObject を組み合わせて、拡大しても劣化しにくいページを構成します。
グラフィックス状態
線幅、線端、塗り色、現在の変換行列、クリッピング領域などはグラフィックス状態として管理されます。状態を保存してから局所的に変更し、描画後に復元すると、後続の描画へ意図しない影響を残しません。
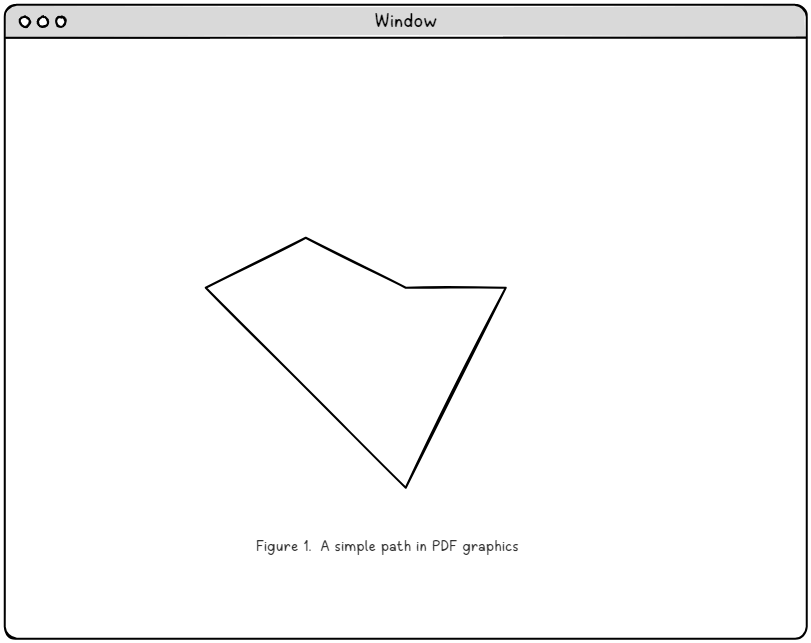
基本パス
move、line、curve、close を組み合わせて形状を定義します。
|
1 2 3 4 5 |
100 100 m % Move to point (100, 100) 200 200 l % Draw line to (200, 200) 300 100 l % Draw line to (300, 100) h % Close the path S % Stroke the path |
パスの描画と塗り
パスは定義しただけでは表示されません。stroke、fill、fill and stroke などの描画演算子によって、線や面としてページに反映されます。
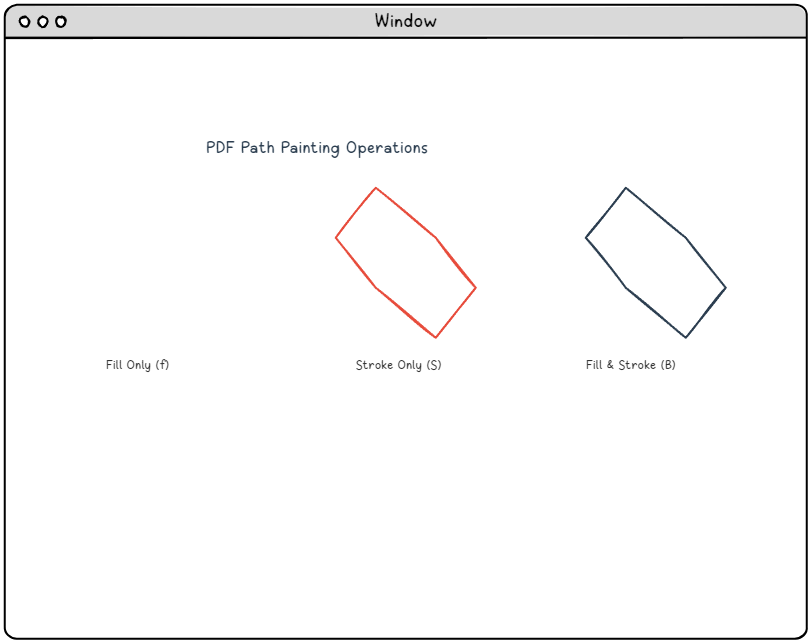
パス描画例 1
パス構築と描画演算子の組み合わせを確認します。
|
1 2 3 4 |
200 250 m % Start at point (200, 250) 300 350 400 450 500 250 c % Create a Bézier curve 400 250 300 200 y % Add another curve segment h % Close the path |
パス描画例 2
パス構築と描画演算子の組み合わせを確認します。
|
1 2 3 4 5 |
200 250 m % Start the path 300 350 400 450 500 250 c % Create curves 400 250 300 200 y % Complete the shape h % Close the path f % Fill the path |
パス描画例 3
パス構築と描画演算子の組み合わせを確認します。
|
1 2 3 4 5 6 |
2.0 w % Set line width to 2 points 200 250 m % Start the path 300 350 400 450 500 250 c % Create the shape 400 250 300 200 y % Complete curves h % Close path S % Stroke the path |
パス描画例 4
パス構築と描画演算子の組み合わせを確認します。
|
1 2 3 4 5 6 7 8 |
2.0 w % Set stroke width 0.8 g % Set fill to light gray 0 G % Set stroke to black 200 250 m % Begin path construction 300 350 400 450 500 250 c 400 250 300 200 y h % Close path B % Fill and stroke |
色空間と色指定
PDF では DeviceGray、DeviceRGB、DeviceCMYK などの色空間を使い分けます。画面表示、業務文書、印刷入稿では求められる色管理が異なるため、出力先に合わせた指定が必要です。
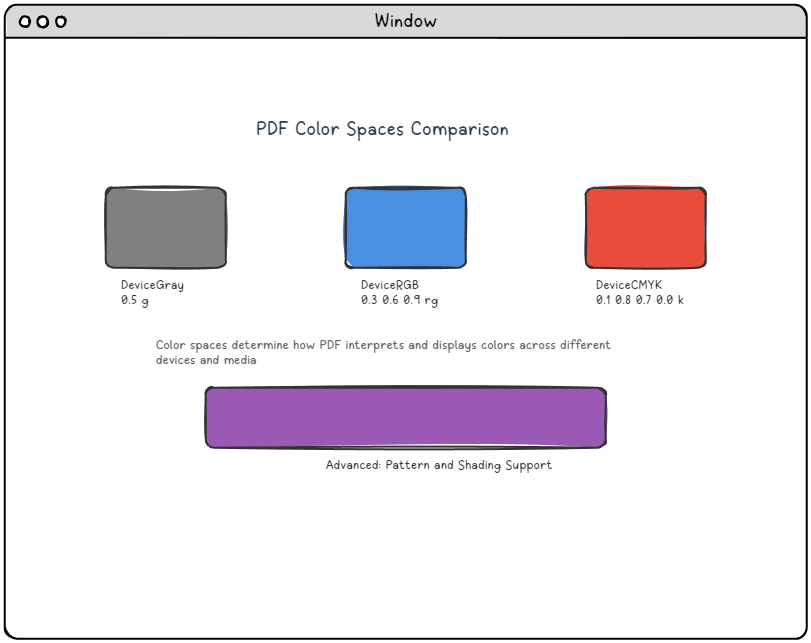
色指定の例 1
色空間と塗り色、線色の指定方法を確認します。
|
1 2 |
/DeviceGray cs % Select DeviceGray color space 0.5 g % Set gray level to 50% |
色指定の例 2
色空間と塗り色、線色の指定方法を確認します。
|
1 2 3 |
/DeviceRGB cs % Select RGB color space 0.2 0.6 0.8 rg % Set fill color (blue-green) 0.8 0.2 0.1 RG % Set stroke color (red) |
色指定の例 3
色空間と塗り色、線色の指定方法を確認します。
|
1 2 |
/DeviceCMYK cs % Select CMYK color space 0.2 0.8 0.0 0.1 k % Set fill color (magenta-heavy) |
色指定の例 4
色空間と塗り色、線色の指定方法を確認します。
|
1 2 3 |
[a b 0] [c d 0] where: [x' y' 1] = [x y 1] × CTM [e f 1] |
色指定の例 5
色空間と塗り色、線色の指定方法を確認します。
|
1 |
1 0 0 1 100 50 cm % Translate by (100, 50) |
座標変換
現在の変換行列を変更すると、同じ図形を移動、拡大縮小、回転できます。変換は強力ですが、範囲を限定しないとページ全体の描画に影響するため、保存と復元を組み合わせて扱います。
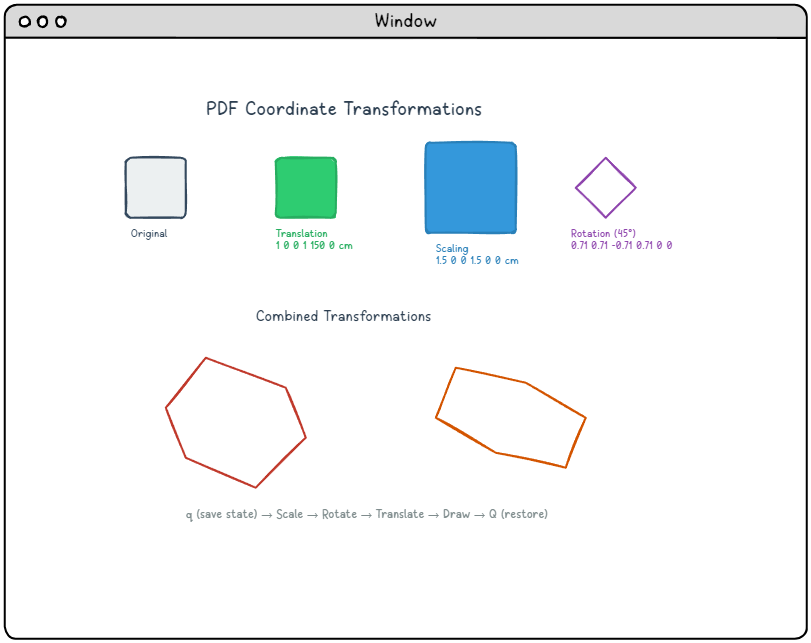
座標変換の例 1
変換行列による図形の再配置を確認します。
|
1 |
2 0 0 1.5 0 0 cm % Scale x by 2, y by 1.5 |
座標変換の例 2
変換行列による図形の再配置を確認します。
|
1 |
0.707 0.707 -0.707 0.707 0 0 cm % Rotate 45° (π/4 radians) |
座標変換の例 3
変換行列による図形の再配置を確認します。
|
1 |
1 0.5 0 1 0 0 cm % Skew along x-axis |
座標変換の例 4
変換行列による図形の再配置を確認します。
|
1 2 3 4 5 |
q % Save current graphics state 2 0 0 2 100 100 cm % Scale by 2 and translate % ... draw scaled content ... Q % Restore original state % Continue with original coordinate system |
座標変換の例 5
変換行列による図形の再配置を確認します。
|
1 2 3 4 5 6 7 8 |
% Define triangular clipping path 200 100 m 200 500 l 500 100 l h % Close the path W % Set as clipping region S % Stroke the clipping boundary % All subsequent drawing is clipped to this triangle |
座標変換の例 6
変換行列による図形の再配置を確認します。
|
1 2 3 4 5 |
<< /ExtGState % Define external graphics state << /gs1 % Name for this state collection << /ca 0.5 >> % 50% fill transparency >> >> |
高度な視覚効果
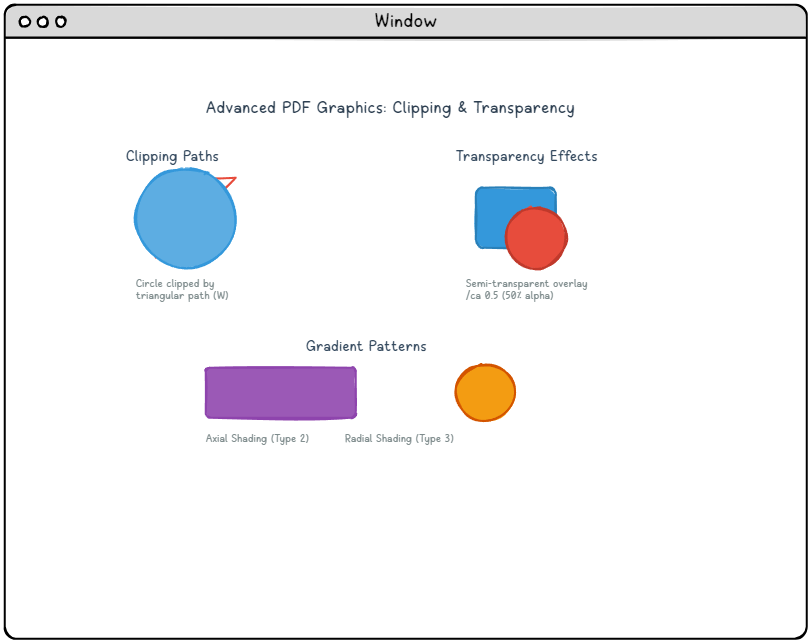
クリッピング パス、透明度、ブレンド、パターン、シェーディングを使うと、図版やレポートの表現力を高められます。実装時はビューア間の差や印刷結果も確認してください。
高度な描画例 1
高度な描画機能の動作を検証するためのコードです。
|
1 2 3 |
/gs1 gs % Apply transparency state 0.75 g % Set light gray fill % Draw semi-transparent content |
高度な描画例 2
高度な描画機能の動作を検証するためのコードです。
|
1 2 3 4 5 6 7 8 9 10 11 12 13 14 15 16 |
/Pattern % Switch to pattern color space << /GradientShading % Pattern name << /Type /Pattern /PatternType 2 % Shading pattern /Shading << /ColorSpace /DeviceGray /ShadingType 2 % Axial shading /Coords [150 200 450 500] % Start and end points /Function << /FunctionType 2 /N 1 /Domain [0 1] >> /Extend [true true] >> >> >> |
高度な描画例 3
高度な描画機能の動作を検証するためのコードです。
|
1 2 3 |
/Pattern cs % Select pattern color space /GradientShading scn % Apply our gradient pattern % Draw shape with gradient fill |
高度な描画例 4
高度な描画機能の動作を検証するためのコードです。
|
1 2 |
/ShadingType 3 % Radial shading /Coords [400 400 0 400 400 200] % Inner and outer circles |
高度な描画例 5
高度な描画機能の動作を検証するためのコードです。
|
1 2 3 4 |
% Smooth gradient with many color stops /Function << /FunctionType 3 /Domain [0 1] /Functions [func1 func2 func3 func4] /Bounds [0.25 0.5 0.75] >> |
高度な描画例 6
高度な描画機能の動作を検証するためのコードです。
|
1 2 |
% Simple two-color gradient /Function << /FunctionType 2 /Domain [0 1] /N 1 >> |
高度な描画例 7
高度な描画機能の動作を検証するためのコードです。
|
1 2 3 4 5 6 7 8 9 |
/XObject << /Logo << /Type /XObject /Subtype /Form /BBox [0 0 200 100] % Bounding box /Matrix [1 0 0 1 0 0] % Transformation matrix /Length 45 >> >> |
高度な描画例 8
高度な描画機能の動作を検証するためのコードです。
|
1 2 3 4 5 6 7 8 |
stream q % Save graphics state 1 0 0 RG % Red stroke color 2 w % 2-point line width 10 10 180 80 re % Rectangle path S % Stroke the rectangle Q % Restore graphics state endstream |
高度な描画例 9
高度な描画機能の動作を検証するためのコードです。
|
1 2 3 4 |
q % Save current state 2 0 0 2 100 100 cm % Scale by 2, translate to (100,100) /Logo Do % Invoke the Logo XObject Q % Restore state |
XObject と再利用
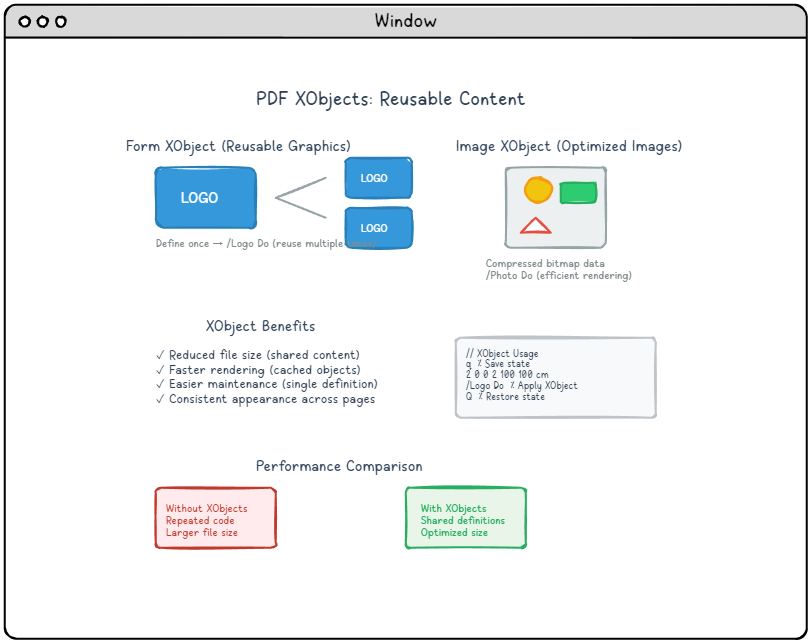
フォーム XObject や画像 XObject を使うと、同じ内容を複数箇所で再利用できます。ロゴ、透かし、繰り返し図形を効率よく扱うと、ファイルサイズと処理時間を抑えられます。
XObject 関連例 1
再利用可能な描画リソースを扱うためのコード例です。
|
1 2 3 4 5 6 7 8 9 10 11 12 |
/XObject << /Photo << /Type /XObject /Subtype /Image /Width 640 /Height 480 /BitsPerComponent 8 /ColorSpace /DeviceRGB /Filter /DCTDecode % JPEG compression /Length 45670 >> >> |
XObject 関連例 2
再利用可能な描画リソースを扱うためのコード例です。
|
1 2 3 4 |
q 640 0 0 480 50 300 cm % Scale and position the image /Photo Do % Render the image Q |
XObject 関連例 3
再利用可能な描画リソースを扱うためのコード例です。
|
1 2 3 4 5 6 7 8 9 10 11 12 13 14 15 |
% Master template containing multiple sub-elements /XObject << /HeaderTemplate << ... >> /FooterTemplate << ... >> /MainContent << /Type /XObject /Subtype /Form % References other XObjects stream /HeaderTemplate Do % ... main content ... /FooterTemplate Do endstream >> >> |
XObject 関連例 4
再利用可能な描画リソースを扱うためのコード例です。
|
1 2 3 4 5 6 7 |
% Inefficient: Many small line segments 100 100 m 101 101 l 102 102 l 103 103 l ... (hundreds of points) % Efficient: Smooth curve 100 100 m 110 105 120 110 150 120 c % Single cubic curve |
XObject 関連例 5
再利用可能な描画リソースを扱うためのコード例です。
|
1 2 3 4 5 6 7 8 9 10 |
% Inefficient: Repeated color changes 1 0 0 rg 100 100 50 50 re f % Red rectangle 1 0 0 rg 200 100 50 50 re f % Same red, redundant 1 0 0 rg 300 100 50 50 re f % Same red, redundant % Efficient: Set color once 1 0 0 rg % Set red once 100 100 50 50 re f % Rectangle 1 200 100 50 50 re f % Rectangle 2 300 100 50 50 re f % Rectangle 3 |
XObject 関連例 6
再利用可能な描画リソースを扱うためのコード例です。
|
1 2 3 4 5 6 7 8 9 |
q % Save initial state % Apply common transformations/settings 2 w % Set line width once 0.5 G % Set gray level once % Draw multiple elements with shared properties 100 100 m 200 200 l S % Line 1 150 150 m 250 250 l S % Line 2 Q % Restore state efficiently |
XObject 関連例 7
再利用可能な描画リソースを扱うためのコード例です。
|
1 2 3 4 5 |
% Problem: Path defined but not painted 100 100 m 200 200 l % Path exists but invisible % Solution: Add painting operator 100 100 m 200 200 l S % Now the line will appear |
まとめ
PDF グラフィックスは、パス、状態、色、変換、再利用リソースを組み合わせる体系です。内部構造を理解すると、軽量で拡大に強く、印刷にも耐える PDF 出力を設計できます。