HotXLS creates Excel Sparklines — the mini charts Excel draws inside a single cell — from Delphi and C++Builder with one call: TXLSXWorksheet.AddSparklineGroup builds a sparkline group over a data range, and saving the workbook writes it as an x14 extension block inside the worksheet extLst, which Excel 2010 and later render and older readers skip without complaint. No chart objects, no drawing parts, no anchors
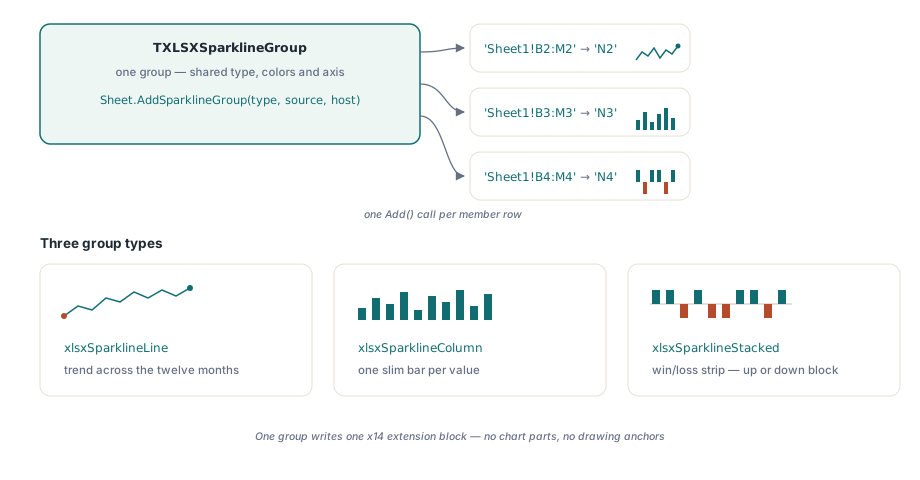
The scenario that makes sparklines worth having is always the same one. A dashboard workbook carries a few hundred rows, one per product or region or account, twelve monthly figures each, and somebody wants a trend glyph at the end of every row. Model that with real charts and you are creating hundreds of DrawingML chart parts, each with its own XML part, relationship, and anchor geometry, to say nothing of what that does to file size and open time. A sparkline group is one XML block that says "draw a tiny line from B2:M2 into N2, and from B3:M3 into N3," repeated cheaply for as many rows as you have
Why are sparklines an x14 extension instead of a chart?
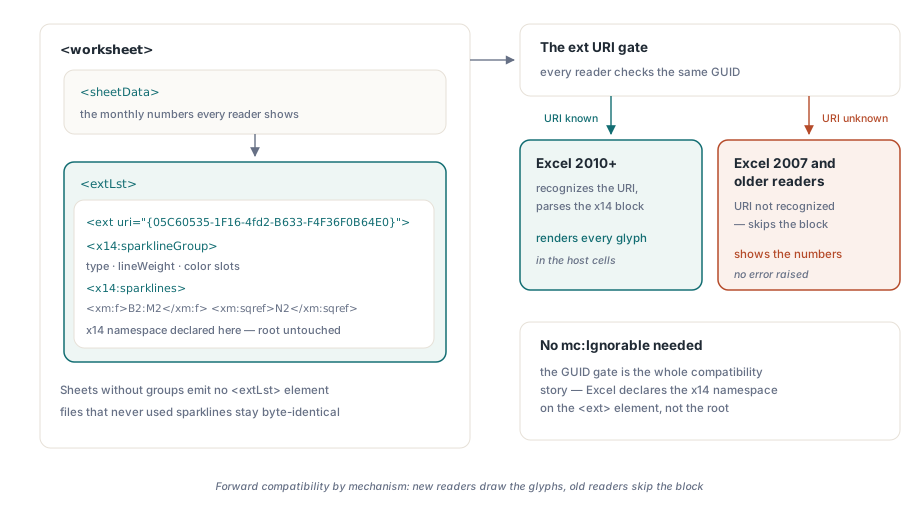
Sparklines arrived with Excel 2010, three years after the ECMA-376 base schema was frozen, so they could not live in the worksheet markup proper without breaking every existing reader. Microsoft's answer is the extension list mechanism: a worksheet may end with an <extLst> element holding <ext> blocks, each tagged with a URI that identifies the feature ([MS-XLSX] §2.3.6). Sparklines use the URI {05C60535-1F16-4fd2-B633-F4F36F0B64E0} and the x14 namespace. A reader that recognises the GUID parses the block; a reader that does not is required to skip it. That is the entire forward-compatibility story, and it is why Excel 2007 opens a sparkline workbook cleanly — it simply shows the source numbers without the glyphs
One detail of the mechanism is worth calling out because it contradicts a common assumption: no mc:Ignorable declaration is needed on the worksheet root. The ext GUID gate is sufficient by itself, and Excel's own writer declares the x14 namespace locally on the <ext> element rather than touching the root. HotXLS follows the same pattern, which keeps the rest of the worksheet XML untouched. This is also the structural difference from real charts: a chart is a separate DrawingML part with its own rendering pipeline, covered in the companion article on charts, images, and drawings, while a sparkline is worksheet metadata that the spreadsheet grid itself paints
How do you add sparklines to an XLSX file programmatically?
TXLSXWorksheet.AddSparklineGroup(AType, ASourceRange, ALocation) is the one-call path: it creates a group of the given type, seeds it with Excel's default series colour, and adds the first sparkline mapping a sheet-qualified source range onto a host cell. The returned TXLSXSparklineGroup then accepts more sparklines through its Add method, one F/Sqref pair per row, all sharing the group's type and formatting. For the dashboard case that is exactly the shape you want: one group, one set of visual options, hundreds of members
var
  Book: TXLSXWorkbook;
  Sheet: TXLSXWorksheet;
  Grp: TXLSXSparklineGroup;
  Row: Integer;
begin
  Book := TXLSXWorkbook.Create;
  try
    Book.Open('dashboard.xlsx');
    Sheet := Book.Sheets[0];

    // One group: every product row shares type and formatting
    Grp := Sheet.AddSparklineGroup(xlsxSparklineLine,
      'Sheet1!B2:M2', 'N2');
    for Row := 3 to 201 do
      Grp.Add(Format('Sheet1!B%d:M%d', [Row, Row]),
        Format('N%d', [Row]));

    Book.SaveAs('dashboard-trends.xlsx');
  finally
    Book.Free;
  end;
end;
TXLSXSparklineType covers the three kinds Excel offers: xlsxSparklineLine for trend lines, xlsxSparklineColumn for tiny bar charts, and xlsxSparklineStacked for win/loss strips where every value renders as an up or down block. Each member sparkline is just two strings — F, the sheet-qualified source range, and Sqref, the cell the glyph is drawn in — so there is nothing else to configure per row. Groups can also be built entirely by hand through the Worksheet.SparklineGroups collection when you want to start from a blank group rather than the seeded default
Markers, colour slots, and axis scaling on the typed model
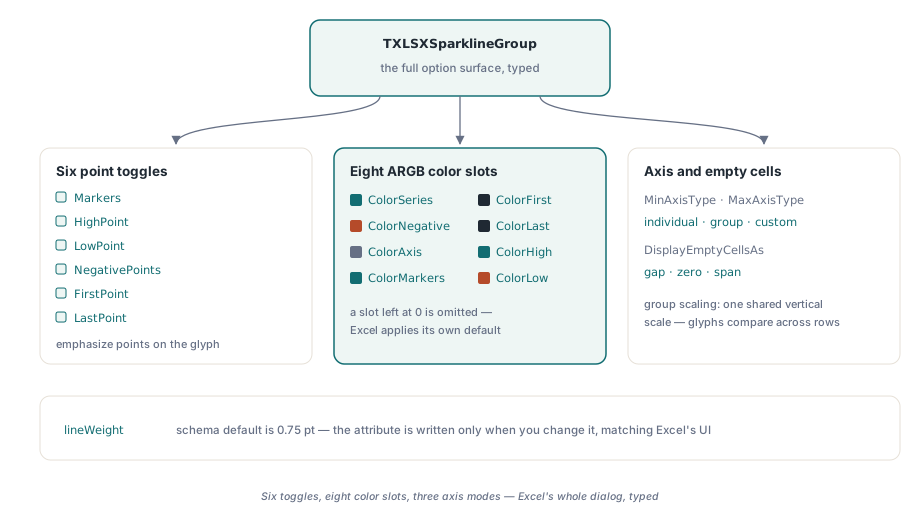
TXLSXSparklineGroup exposes the full option set from Excel's Sparkline Tools ribbon as plain properties. Six boolean toggles emphasise data points: Markers for every point on a line sparkline, plus HighPoint, LowPoint, NegativePoints, FirstPoint, and LastPoint. Eight ARGB colour slots pair with them — ColorSeries, ColorNegative, ColorAxis, ColorMarkers, ColorFirst, ColorLast, ColorHigh, ColorLow — with the convention that a slot left at 0 is omitted from the file and Excel applies its own default. The same fully-opaque ARGB form appears across the library, so $FFD00000 here means the same red it means in conditional formatting styles
Grp := Sheet.AddSparklineGroup(xlsxSparklineStacked,
  'Sheet1!B2:M2', 'N2');
Grp.NegativePoints := True;          // losing months stand out
Grp.ColorNegative := $FFD00000;
Grp.HighPoint := True;
Grp.ColorHigh := $FF00B050;
Grp.MinAxisType := xlsxSparklineAxisGroup;   // one scale for all rows
Grp.MaxAxisType := xlsxSparklineAxisGroup;
Grp.DisplayEmptyCellsAs := xlsxSparklineEmptyGap;
The axis properties deserve a moment of thought before you accept the defaults. MinAxisType and MaxAxisType each take individual, group, or custom scaling: individual stretches every sparkline to its own min and max, which makes a row that wobbles between 99 and 101 look as dramatic as a row that triples. Group scaling puts every member on one shared vertical scale, so glyph height means the same quantity in every row — usually what a comparative dashboard wants. DisplayEmptyCellsAs decides what a blank source cell does to a line: leave a gap, count as zero, or span the hole by connecting its neighbours
What HotXLS writes into the worksheet extLst on save
On save, HotXLS serialises each group as an x14:sparklineGroup element carrying the type and toggle attributes, the colour slots as child elements, and an x14:sparklines list whose members pair an xm:f range formula with an xm:sqref host cell. The whole structure sits inside <extLst><ext uri="{05C60535-1F16-4fd2-B633-F4F36F0B64E0}"> at the end of the worksheet part, with the x14 namespace declared right on the block, exactly as Excel writes it. A worksheet with no sparkline groups emits no extLst at all, so files that never used the feature come out byte-for-byte identical to what earlier HotXLS versions produced — the same conservative-writer discipline described in the article on lossless round-trip infrastructure
One spec detail matters if you ever compare output against Excel's or hand-check the XML: the schema default for lineWeight is 0.75 points, not the 1.25 some secondary sources quote — [MS-XLSX] defines CT_SparklineGroup@lineWeight with a default of 0.75, matching the weight Excel's UI actually applies. HotXLS honours the default by omission: set LineWeight to anything other than 0.75 and the attribute is written, leave it at 0.75 and it is not. Getting this wrong in either direction produces files that render subtly heavier or lighter than the same workbook saved from Excel
Round-trips, sheet copies, and extensions HotXLS does not model
Opening is the mirror image of saving. When HotXLS opens a workbook that carries sparklines — whether HotXLS wrote it or Excel did — the parser gates on the sparkline ext GUID and rebuilds every group, member, colour, and axis option into the typed model, so an open→edit→save cycle preserves them completely. Copying a worksheet into another workbook closes its sparkline groups along with the rest of the sheet, which makes template-driven report generation straightforward: keep a styled template sheet, copy it per report, and repoint the ranges
The extLst can also contain extension blocks HotXLS has no typed model for — Excel writes x14 blocks for features like slicers and extended conditional formatting into the same list. Since v2.131.0 those foreign blocks are preserved verbatim across a round-trip rather than dropped: the parser captures them, exposes them read-only through Worksheet.RawWorksheetExts, and writes them back on save, and they travel with a sheet when it is copied to another workbook. The preserved XML is reconstructed from parser events, so it is semantically equivalent to the original rather than byte-identical, but Excel accepts it and the features survive. The practical consequence is the one that matters in production: opening a customer's workbook and resaving it no longer strips extensions you did not ask HotXLS to understand
The honest boundary line: sparklines render in Excel 2010 and later, and in any other reader that implements the x14 extension; Excel 2007 shows the data without the glyphs, which is the degradation the format was designed to have. The three sparkline types, the eight colour slots, the point toggles, and the three axis modes cover the full option surface Excel's own dialog offers. Sparkline support, along with the rest of the XLSX engine shown here, ships in the HotXLS Delphi Excel Component for Delphi and C++Builder