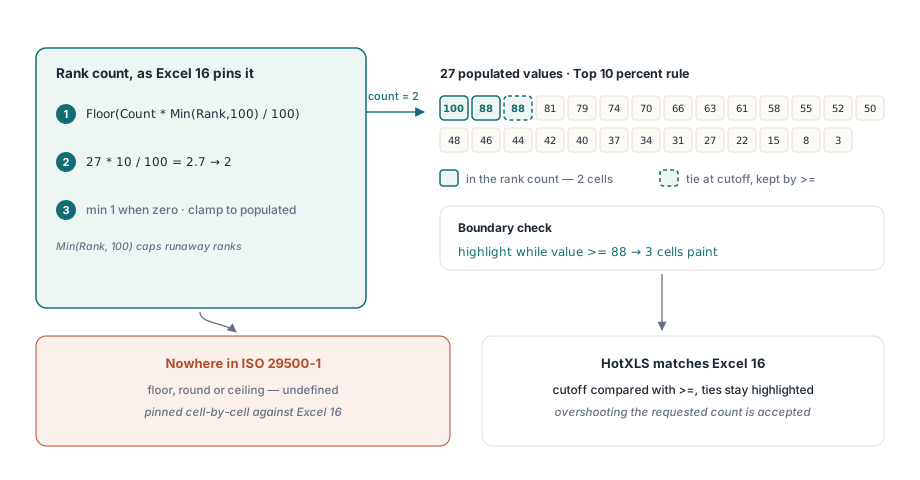
A Top 10 percent rule sits on a column of 27 sales figures, and Excel paints three cells. Ten percent of 27 is 2.7, so a renderer that rounds gets three, a renderer that takes the ceiling gets three, and a renderer that floors gets two. Two of those three guesses match Excel on this column, and both are wrong: Excel floors the count to two and then also paints the third cell because it ties with the second at 88. Change one value and the lucky guesses stop matching
That is the whole difficulty of drawing conditional formatting outside Excel. The rules are in the file; the answer to "which cells light up, and in what colour" is not. If your output is an HTML report, a PDF or a grid you paint yourself, you have to compute it, and the aggregate rule families are where the arithmetic hides. Authoring rules is a separate topic, covered in conditional formatting and rich text styles, and what happens to a rule range when rows move is covered in partitioning anchored conditional formats. This note is about evaluation
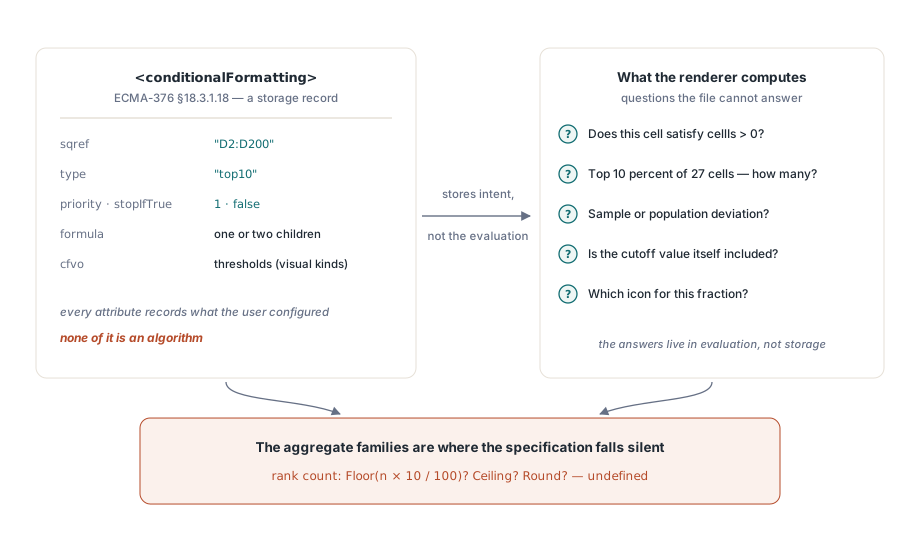
What the conditionalFormatting element does and does not say
ECMA-376 and ISO 29500-1 define storage, and they stop there. A conditionalFormatting element (§18.3.1.18) carries an sqref and a list of cfRule children (§18.3.1.10). Each rule has a type, an optional operator, a priority, a stopIfTrue flag, one or two formula children and, for the visual families, a set of cfvo thresholds. All of that faithfully records what the user clicked in the dialog. None of it is an algorithm
For many rule types the gap is harmless. cellIs with operator="greaterThan" means greater than, and containsText means the substring is present. The trouble starts with rules whose verdict depends on the rest of the range: top10 with percent="1" does not say how a fractional count rounds, aboveAverage with stdDev="1" does not say whether the deviation is sample or population, and neither says whether a value equal to the cutoff qualifies. Pick wrong and your PDF disagrees with the workbook the customer has open in the next window
TCondFormatRule.Evaluate: what one cell can decide on its own
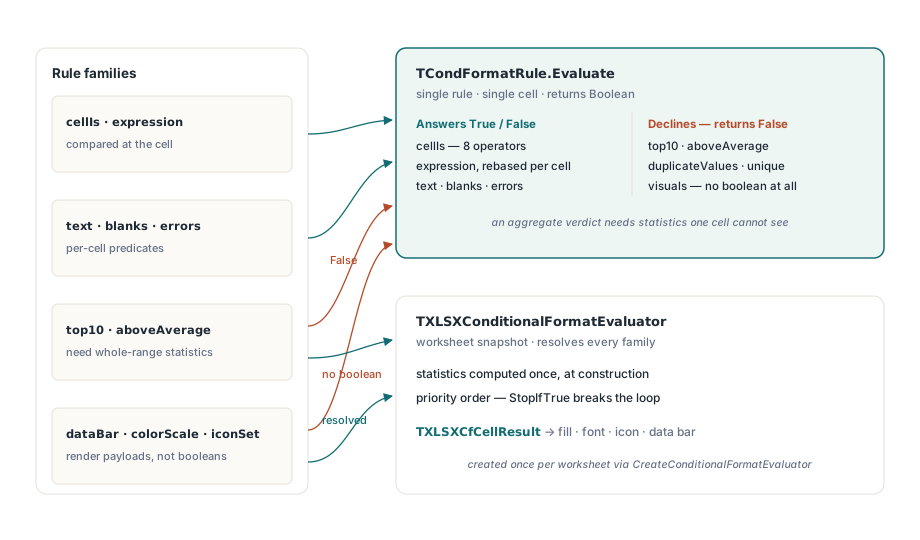
HotXLS has two evaluation surfaces, and they differ in what they are willing to answer. The classic (.xls) engine exposes TCondFormatRule.Evaluate in lxCondFormat.pas, which takes a calculator, a sheet index, a cell position and the cell value, and returns a Boolean for one rule. It covers the eight cellIs operators (between, not between, equal, not equal, greater, less, greater or equal, less or equal), free-form expression rules evaluated at the cell so relative references rebase correctly, the four text predicates, and the blank and error predicates. Threshold formulas are resolved at the cell position, and a between rule whose bounds arrive reversed has them swapped rather than rejected. Text comparisons are case-insensitive, as they are in Excel
// Classic engine: one rule, one cell, one Boolean
function AnyRuleMatches(Calculator: TXLSCalculator; CondFormat: TCondFormat;
  SheetIndex, Row, Col: Integer; const Value: Variant): Boolean;
var
  I: Integer;
begin
  Result := False;
  for I := 0 to CondFormat.RuleCount - 1 do
    // top10, averages, duplicates, time periods and the visual kinds
    // answer False here; they need the whole range
    if CondFormat.Rule(I).Evaluate(Calculator, SheetIndex, Row, Col, Value) then
      Exit(True);
end;
The method returns False for top10, aboveAverage, belowAverage, duplicateValues and uniqueValues. One cell cannot know whether it is in the top ten percent without seeing the other values, so answering would mean guessing. Relative date rules (timePeriod) also answer False on this path. The four visual families, dataBar, colorScale2, colorScale3 and iconSet, answer False for a different reason: they never produce a yes or no, they produce a colour, a bar length or an icon index, and a Boolean has nowhere to put those. A False from this call therefore means "not decided here" as often as it means "does not match", which is fine for a quick check on comparison rules and unsafe for anything you ship
How does a worksheet evaluator avoid rescanning the sheet for every cell?
It does all the range-wide work once, when it is created. TXLSXConditionalFormatEvaluator in lxHandleX.pas is an immutable snapshot of one worksheet's conditional formats, obtained from TXLSXWorksheet.CreateConditionalFormatEvaluator; the caller owns it and frees it. The naive alternative, where every painted cell triggers a scan of its rule range to recompute an average or a rank, turns a 10,000-cell export into 10,000 range scans per rule
At construction the evaluator parses each distinct sqref once, so ten rules over the same range share one parse and one pass over its populated cells. That pass collects mean, population deviation, minimum and maximum in a single walk, and keeps a sorted copy of the numbers only when a Top/Bottom rule or a percentile threshold actually needs order statistics. Duplicate and unique rules get their value keys built and sorted once, so each lookup afterwards is a binary search. Rule formulas are compiled once and re-evaluated per cell with the cell's offset applied, so =A1>AVERAGE($A$1:$A$100) keeps its relative and absolute parts behaving exactly as they would in Excel without being re-parsed for every row. Rows are grouped so that EvaluateCell only visits rules whose ranges can reach the requested row
Rules are then applied in priority order, lowest number first, with ties broken by position in the file. Each formatting property is taken from the first matching rule that sets it, and lower-priority rules only fill properties that are still empty: a priority-1 rule that sets bold and a priority-2 rule that sets a red fill both show, and the cell comes out bold on red. A match on a rule with StopIfTrue ends the walk for that cell
procedure PaintConditional(Sheet: TXLSXWorksheet; Canvas: TCanvas;
  FirstRow, LastRow, FirstCol, LastCol: Integer);
var
  Evaluator: TXLSXConditionalFormatEvaluator;
  Res: TXLSXCfCellResult;
  Row, Col: Integer;
begin
  // One snapshot per render pass; rows and columns are 1-based
  Evaluator := Sheet.CreateConditionalFormatEvaluator;
  try
    for Row := FirstRow to LastRow do
      for Col := FirstCol to LastCol do
      begin
        if not Evaluator.EvaluateCell(Row, Col, Res) then
          Continue;
        if Res.HasFillColor then
          Canvas.Brush.Color := TColor(Res.FillColor and $00FFFFFF);  // BGR, same layout as TColor
        if Res.HasDataBar then  // DrawBar is your own routine
          DrawBar(Row, Col, Res.DataBarAxis, Res.DataBarEnd, Res.DataBarColor);
        if Res.HasIcon then     // DrawIcon is your own routine
          DrawIcon(Row, Col, Res.IconSetType, Res.IconIndex);
        if Res.ShowCellValue and Res.HasNumberFormat and
           Sheet.Cells.HasCell(Row, Col) then  // DrawCellText is your own routine
          DrawCellText(Row, Col,
            Evaluator.FormatValue(Sheet.Cells[Row, Col].Value, Res.NumberFormatId));
      end;
  finally
    Evaluator.Free;
  end;
end;
The snapshot is built once per pass on purpose. Creating it inside the inner loop compiles and scans everything again for every cell, which is the exact cost the design exists to avoid. ShowCellValue comes back False when a data bar rule has showValue="0" or an icon set is set to show the icon only, so the renderer draws the bar or glyph and leaves the number out
How many cells does a Top 10 percent rule really highlight?
The count is floored, never allowed below one, and every value tied with the cutoff is included. The specification does not say this; it is what Excel does, and you can confirm it in a minute by typing the 27 values from the figure into a column, applying Top 10% and counting painted cells. TXLSXConditionalFormatEvaluator computes the rank count as Floor(Count * Min(Rank, 100) / 100), raises it to 1 when it lands at zero, clamps it to the number of populated numeric cells, reads the cutoff from the sorted values, and then compares every cell with >=. For the 27-value column that means a count of two, a cutoff of 88, and three painted cells because two of them hold 88. Bottom-N rules mirror this with <=
Above-average rules carry the second ambiguity. With stdDev="1" the rule selects cells at least one standard deviation above the mean, and sample and population deviation differ by the Bessel correction, which matters most on the short ranges where people actually use this rule. On five values the two differ by about 12 percent. HotXLS uses the population deviation, the same figure STDEV.P returns, so a quick way to check any renderer is to put =AVERAGE(r)+STDEV.P(r) next to the range and see which cells clear it. Comparisons against a deviation band are inclusive; the plain above or below comparison is strict unless the rule carries equalAverage="1"
Duplicate and unique rules turn on what counts as "the same value". The number 100 and the text "100" share a key, because numeric text is normalised into the numeric key space; text keys compare case-insensitively; TRUE and 1 stay distinct, as do error values of different kinds. Text containing * or ? is matched as a wildcard pattern, COUNTIF-style, so a cell holding Q* counts against every value that starts with Q. Blank cells are the opposite trap: a truly empty cell inside the range is never painted as a duplicate, so an unfinished column does not light up from top to bottom, while a cell that stores an empty string is counted with the blanks
Colour scales, data bars and icon sets come back as numbers
The visual families resolve to render-ready values, and their edges are where hand-written renderers drift. For a colour scale, EvaluateCell clamps the position to the interval 0 to 1 and interpolates each RGB channel with truncation, so a value below the minimum stop gets the minimum colour instead of an extrapolated one. A three-stop scale uses the mid-to-max pair for values above the midpoint threshold and the min-to-mid pair otherwise. A scale whose first and last thresholds resolve to the same number returns the last colour instead of dividing by zero. Percentile thresholds are interpolated linearly between neighbouring sorted values, the PERCENTILE.INC definition
Data bars are normalised to the cell width. For a range that is all positive, DataBarAxis is 0 and DataBarEnd runs between the rule's minimum and maximum bar length, which default to 10 and 90 percent, so the smallest value still gets a short bar and the largest never quite fills the cell. When the range spans zero, the axis sits at its proportional position and DataBarEnd marks where the bar stops, on the far side of the axis for negative values. Direction, gradient, border and negative-bar colours are filled in on the same record, with theme colours and tints already resolved
Icon sets need care with each threshold's strictness, because every cfvo after the first carries its own gte flag. The evaluator walks the thresholds upward, applying >= or > per threshold as ThresholdEqualsInclude says, and the highest threshold the value clears wins. A reversed set flips the resolved index, per-icon overrides can substitute a glyph from another family through IconSetType, and a threshold that cannot be resolved stops the rule for that cell, so the cell gets no icon at all rather than a plausible wrong one
One result for the grid, the HTML export and the PDF
TXLSXCfCellResult carries everything a renderer needs: fill and font colour with theme tint applied, bold, italic, underline, strikethrough, a number format id, the data bar geometry and colours, and the icon family and index. HotXLS feeds the same record to its HTML export, its PDF export and TXLSWorkbookViewer, which keeps the three outputs in agreement cell for cell. The viewer creates one evaluator for the active worksheet the first time it paints and reuses it across scrolling, selection and repaint, dropping it when you switch sheets or assign another workbook
// Editing behind a live viewer: the cached snapshot does not see the change
Sheet := Viewer.XlsxWorkbook.Sheets[1];   // 1-based sheet index
Sheet.Cells[5, 2].Value := 4200;          // moves the mean, the max and the ranking
Viewer.RefreshConditionalFormats;         // drop the snapshot and repaint
Because the snapshot is immutable, an in-place edit leaves averages, ranks and colour-scale endpoints stale until RefreshConditionalFormats runs. The same applies to your own code: an evaluator you keep across edits must be freed and recreated, since CreateConditionalFormatEvaluator captures values at the moment it is called
Relative date rules deserve a decision up front. The worksheet evaluator compares timePeriod rules against the machine's current date, so a "this week" rule renders one way in a PDF produced today and another way when the same workbook is exported next Tuesday. That is correct behaviour and still a support ticket if your archive is expected to be reproducible. For archived reports, replace timePeriod rules with an expression rule that compares against a report date stored in a cell, such as =AND(A2>=$Z$1-6,A2<=$Z$1) for a seven-day window; the output then depends on the workbook and nothing else. Excel also refuses structured table references inside a conditional-format formula, so point the rule at the column's cell range instead
If the target is a screen rather than a file, the same result record also drives the custom VCL spreadsheet grid described elsewhere on this blog. The rule model, the evaluator API reference and trial builds are on the HotXLS Delphi spreadsheet component page